Kubernetes cluster と Grafana Cloud を Grafana Alloy で連携してみる(前編) 〜Getting Started Guide の先へ〜

最近 Grafana Cloud を試したんですが、Getting Started Guide に従って Kuberneters cluster に Grafana Alloy をインストールするだけで様々なログやメトリクスが取れるようになるし、メトリクスの取得も高速でとても感動しました。
ただ、Grafana、Prometheus、OpenTelmetry Collector を浅く使ったことがあるだけの自分にとって、ブラックボックス過ぎてわからないことが多く、どこの設定をどう修正すれば好みの内容になるのかわかりづらかったので、備忘録がてら知見についてまとめます。
1 エントリーにまとめようと思ったんですが力尽きたので、前編と後編に分けようと思います。
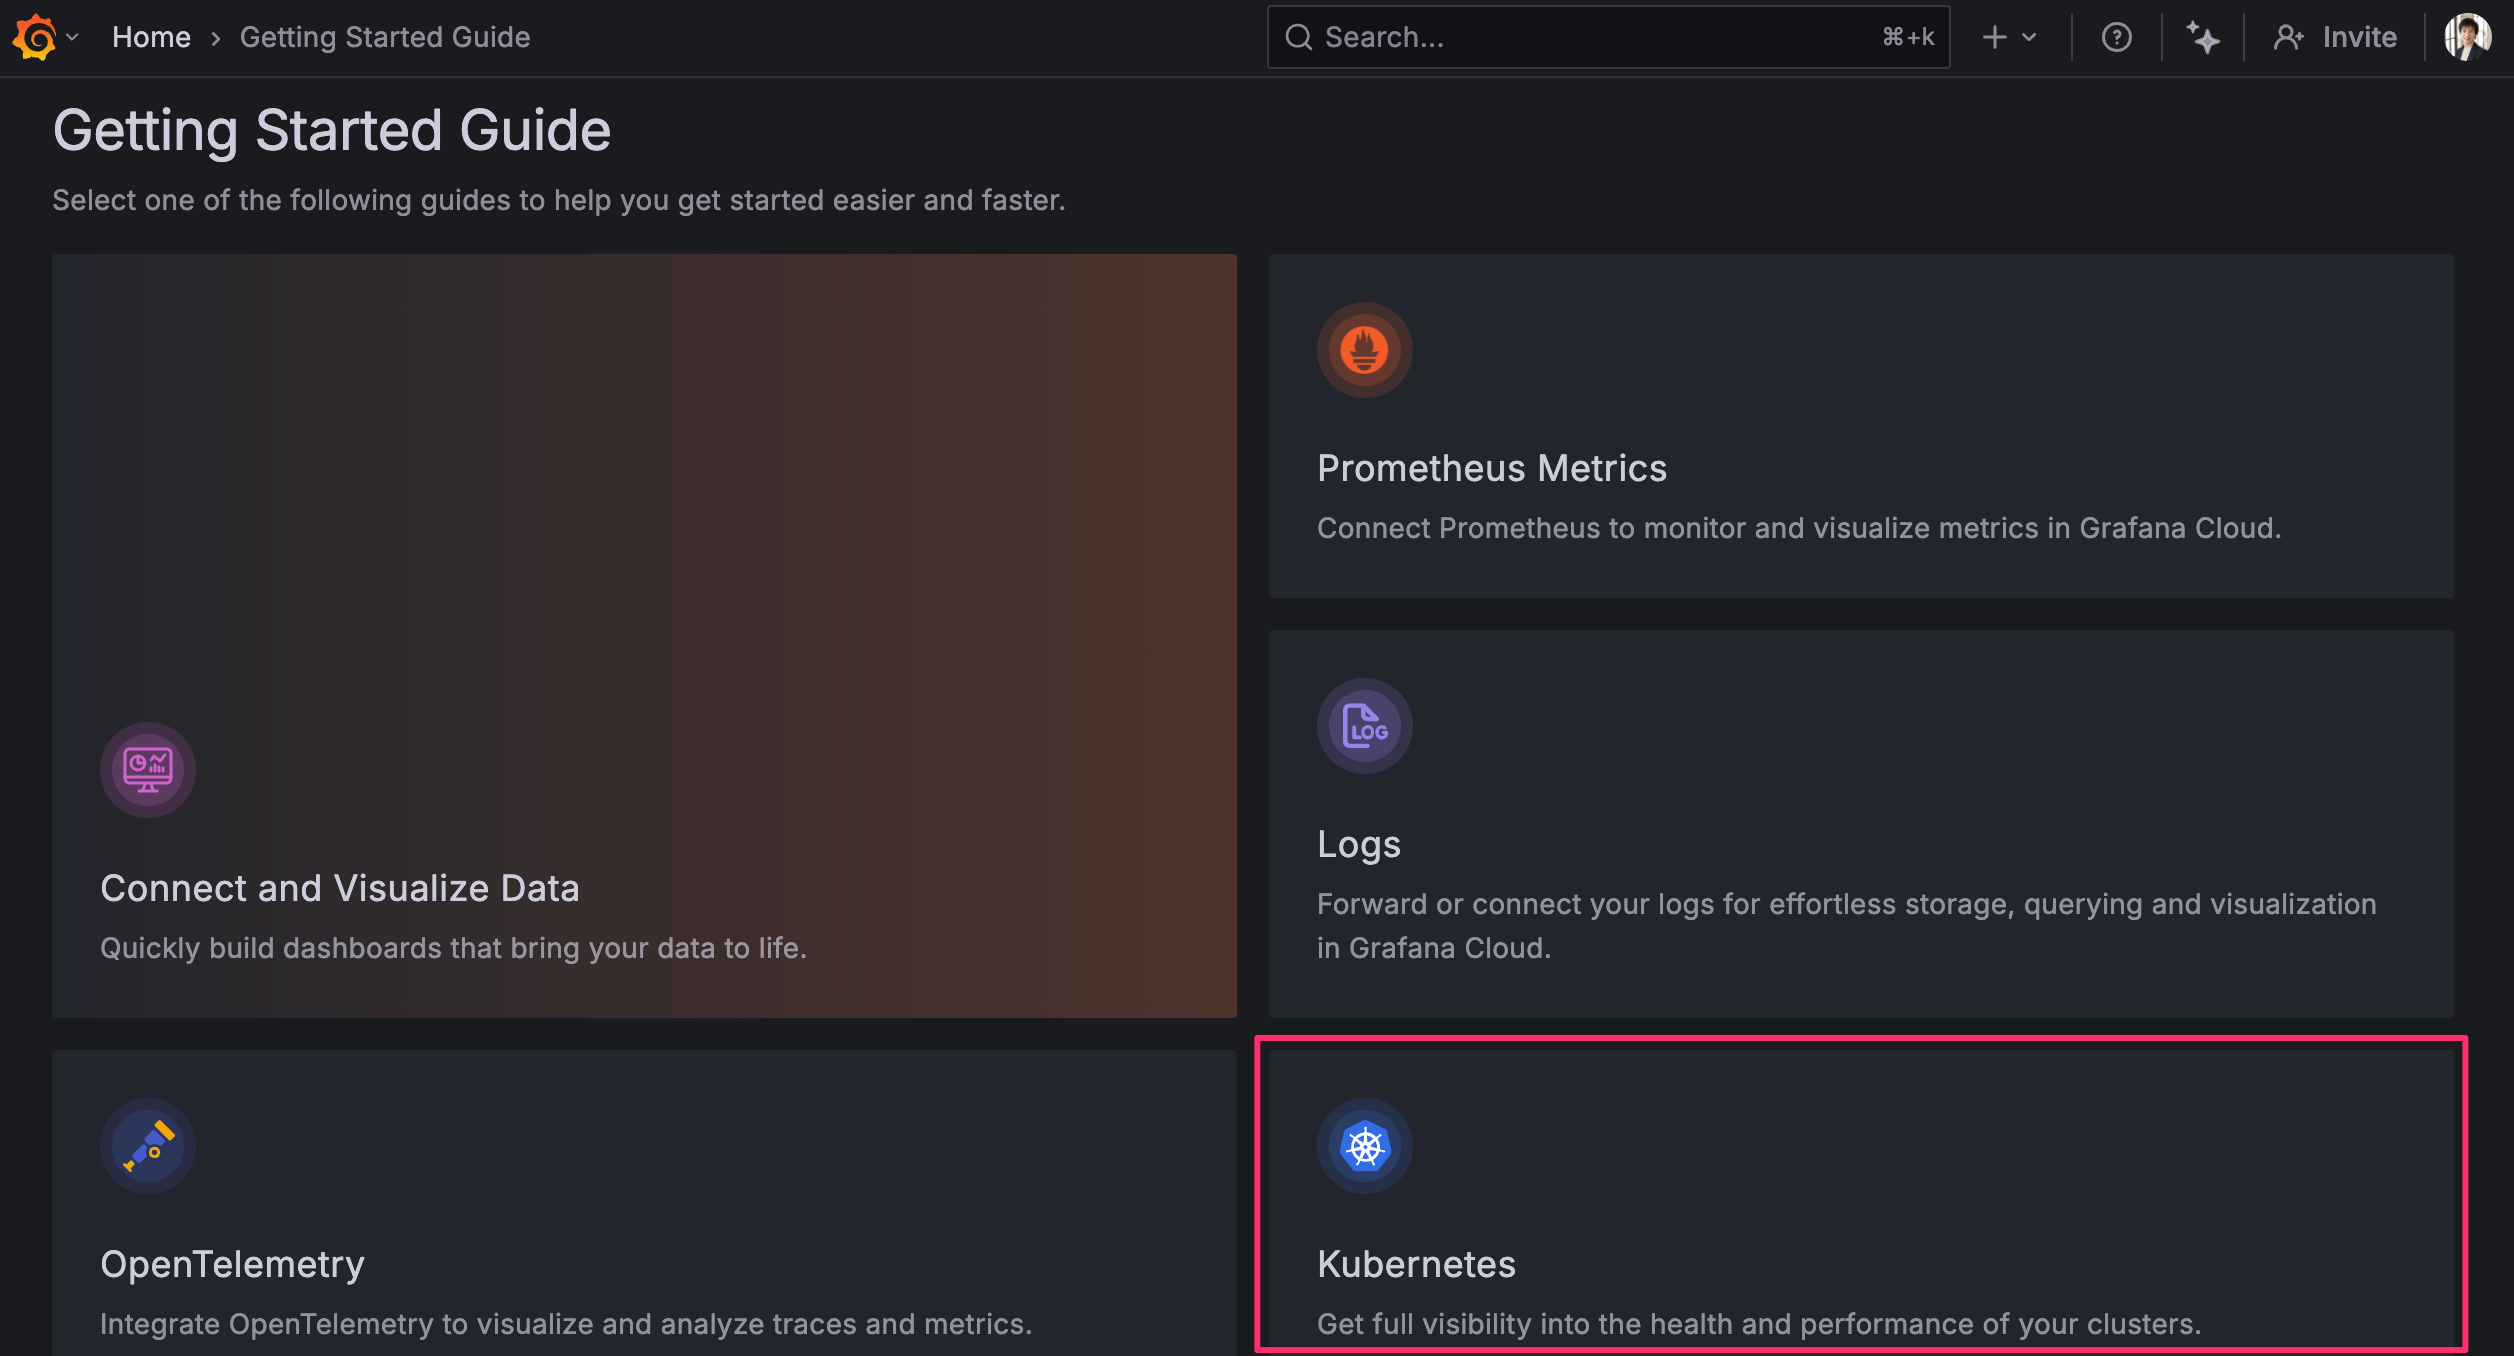
Getting Started Guide に従って連携してみる
Getting Started Guide にはいくつか選択肢があるんですが、Kubernetes 上で使うなら Kubernetes を選択するのが最も良いです。OpenTelemetry の手順に従うと Fleet Management の設定が追加されるのに、生成される token には fleet-management:read の権限が付与されておらず起動に失敗します。
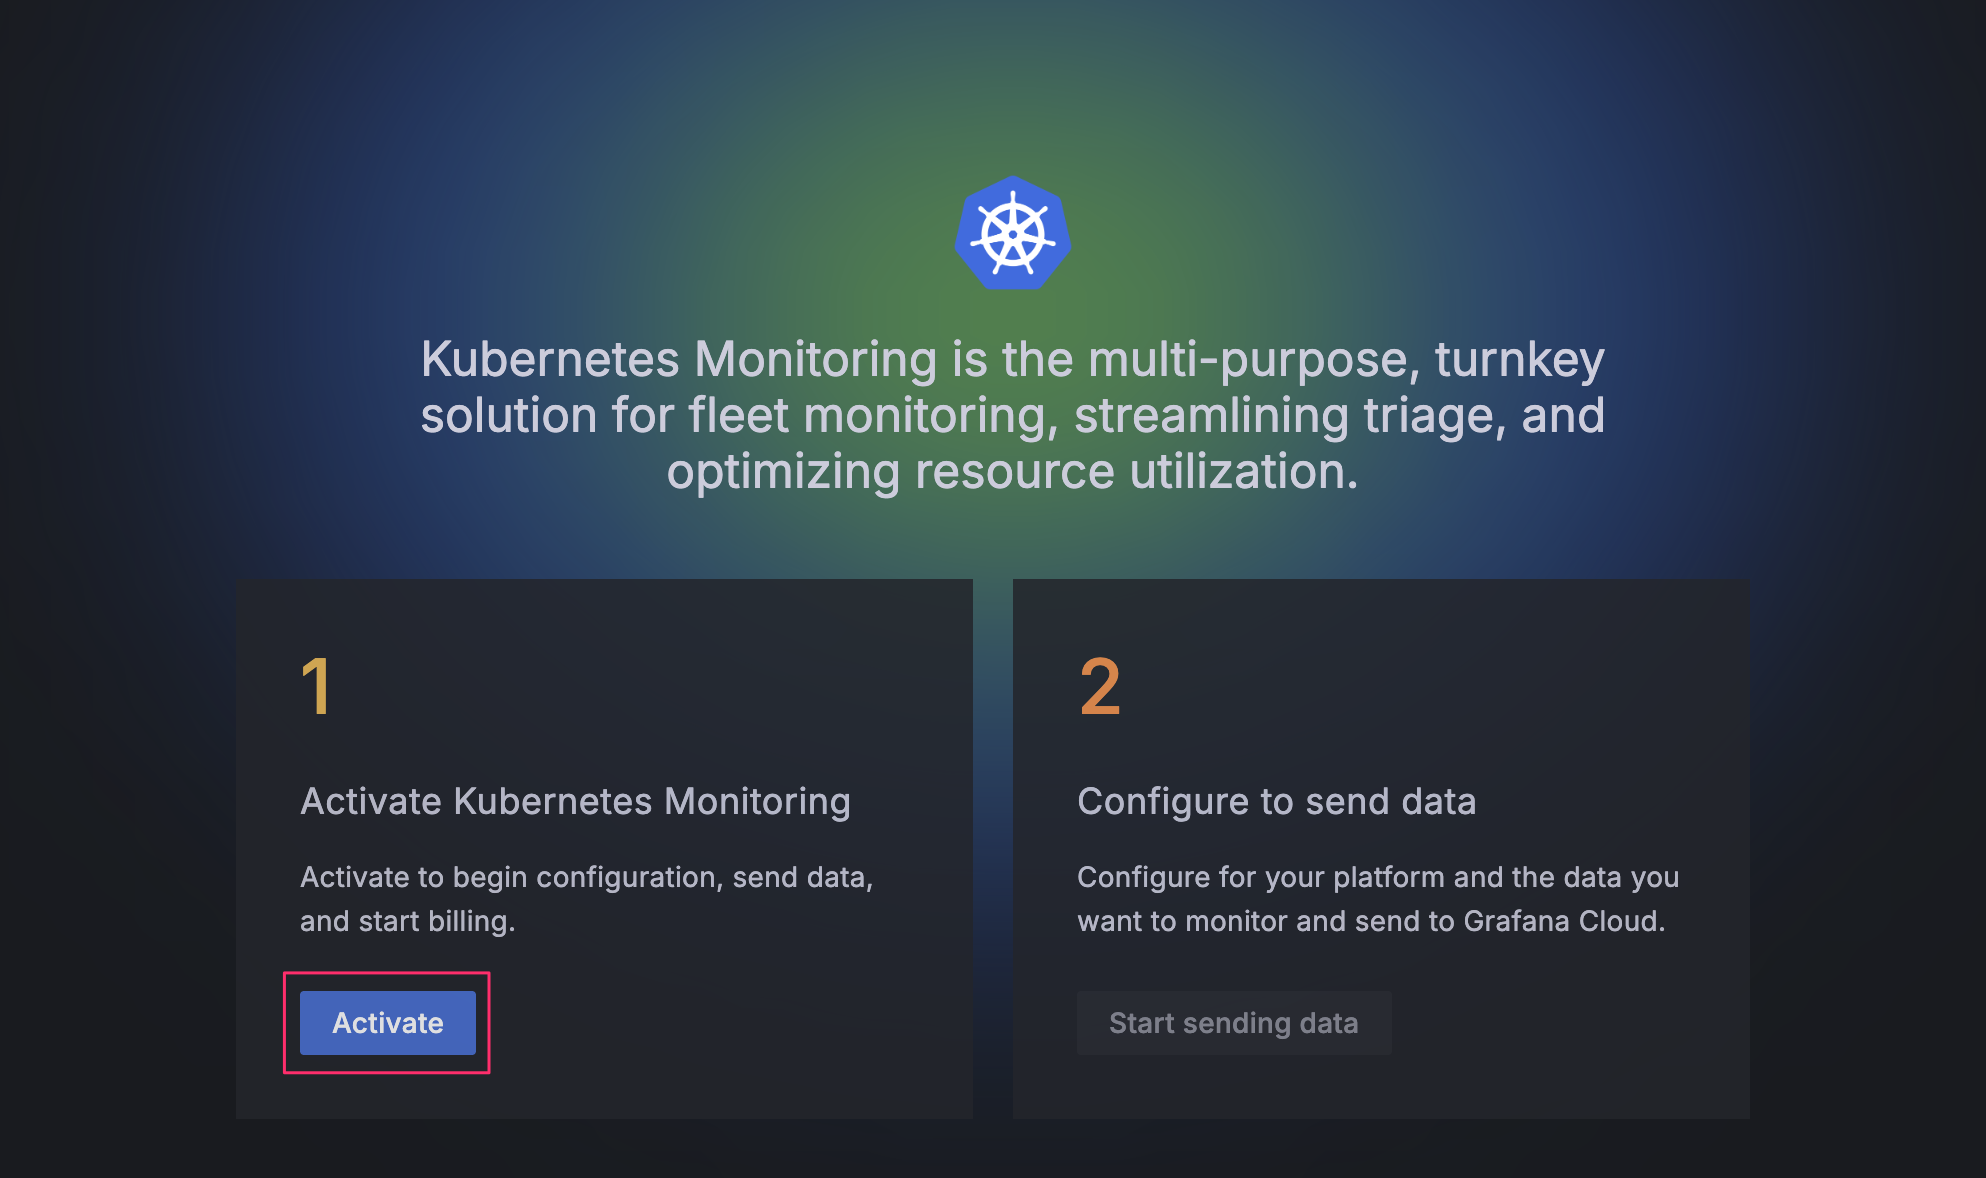
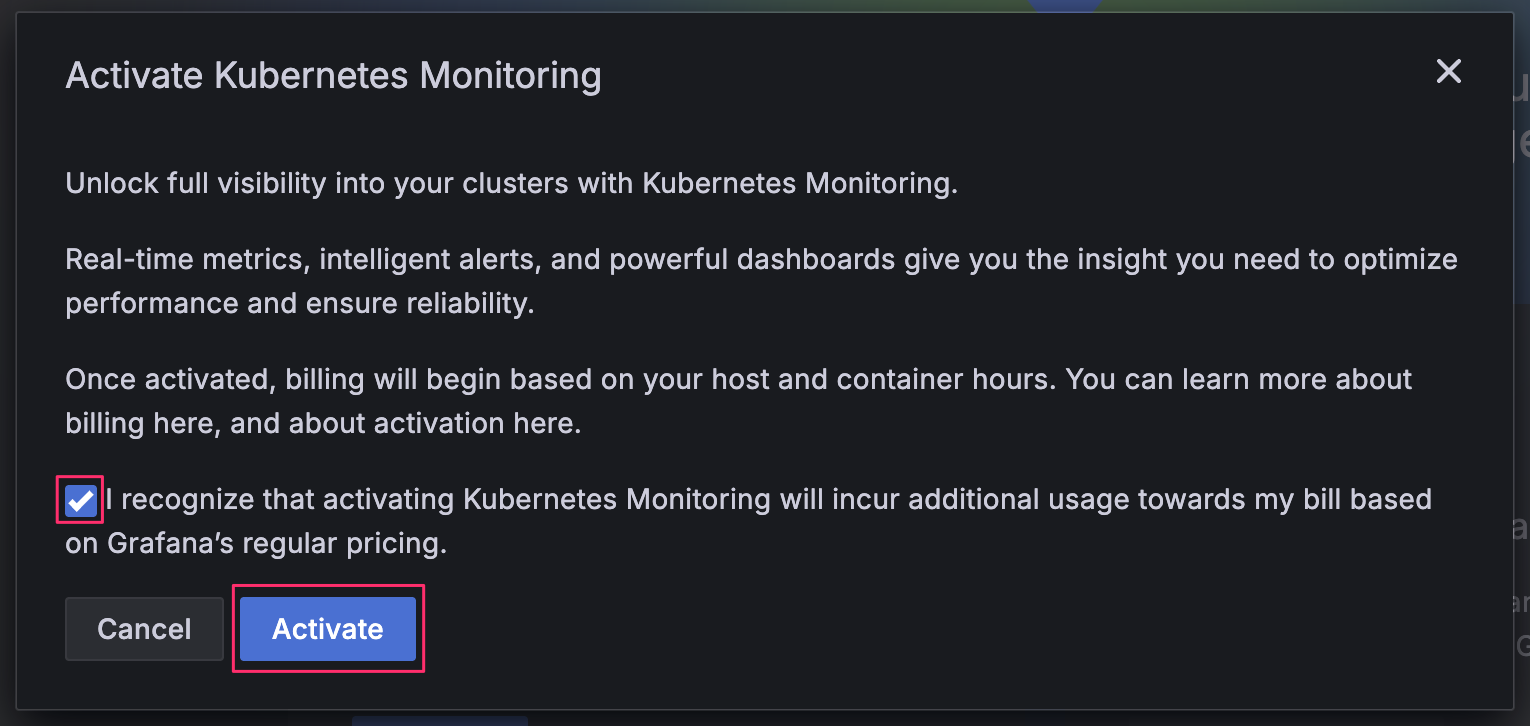
最近は Kubernetes を選択すると「利用状況に応じて料金がかかるけど有効化しますか?」みたいなことが聞かれるようになったんですが、動作確認のために使う分にはよっぽどヘマをしない限り無料枠に収まるので気にせず Activate ボタンを押すと良いと思います。
このガイドでは、回答する内容にしたがって Alloy をインストールするためのコマンドや Terraform ファイルの内容が表示されるようになっています。
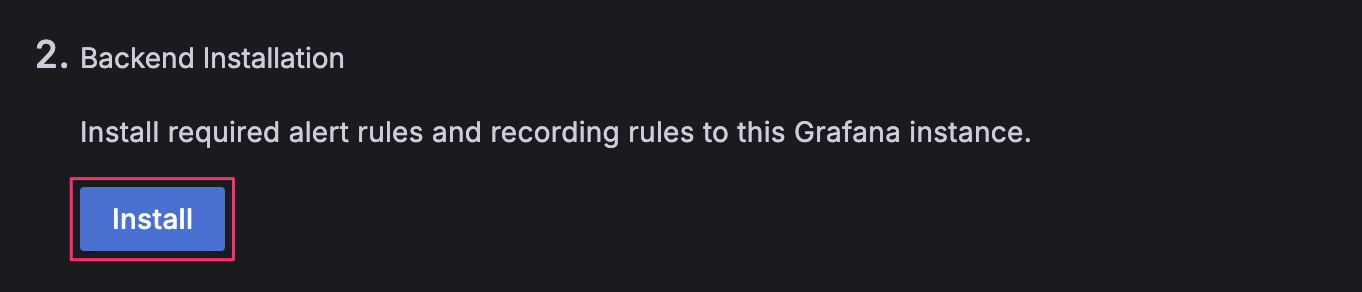
まずは alert rule と recording rule をインストールします。インストールされた rule は Grafana の Web UI の /alerting/list から確認できます。
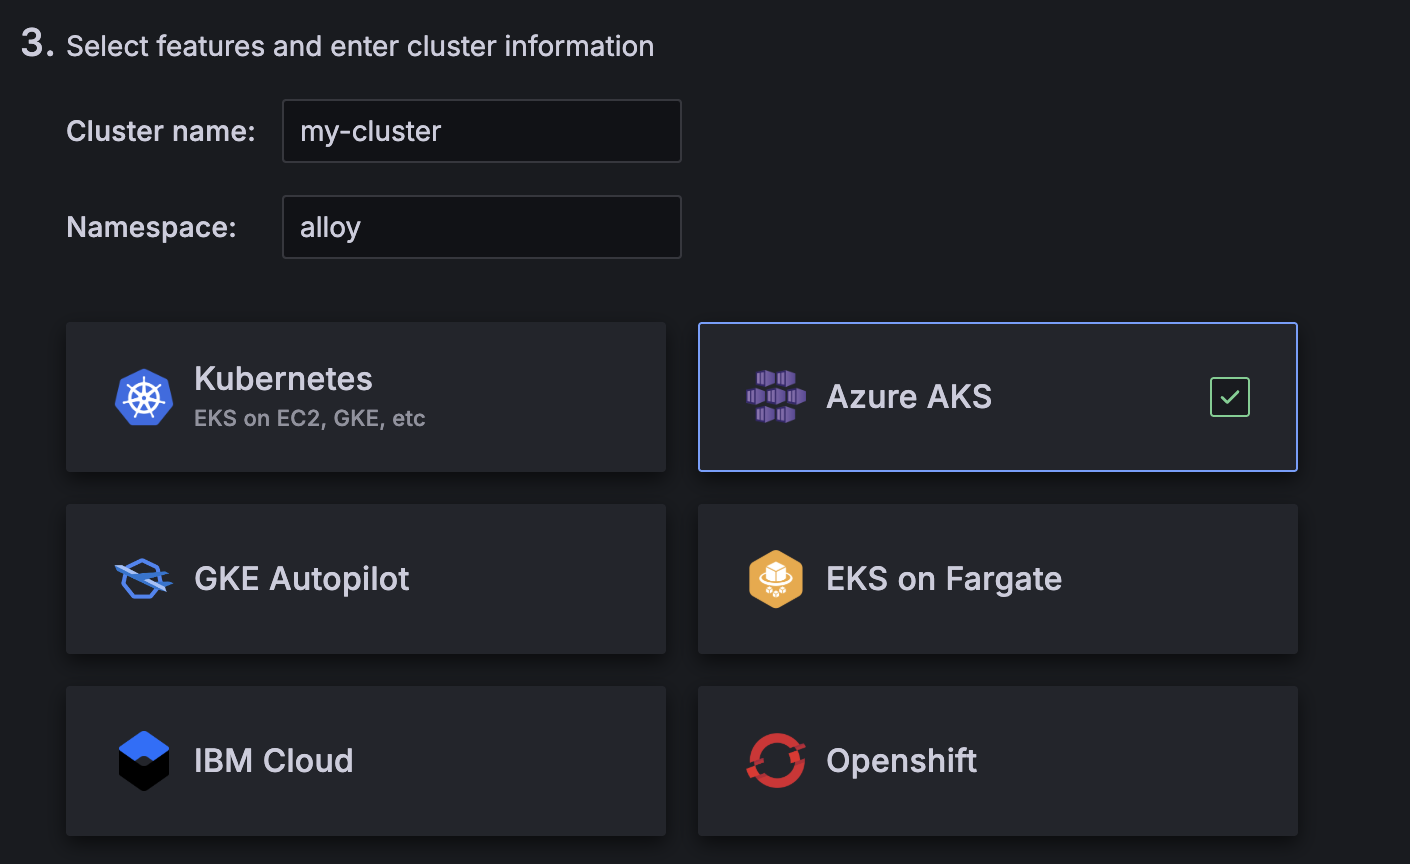
Namespace には Alloy のインストール先の namespace 名を指定します。今回は alloy とします。そして Kubernetes サービスとして自身の利用しているサービスを選択します。自分の場合は AKS で使いたかったので AKS を選択しています。
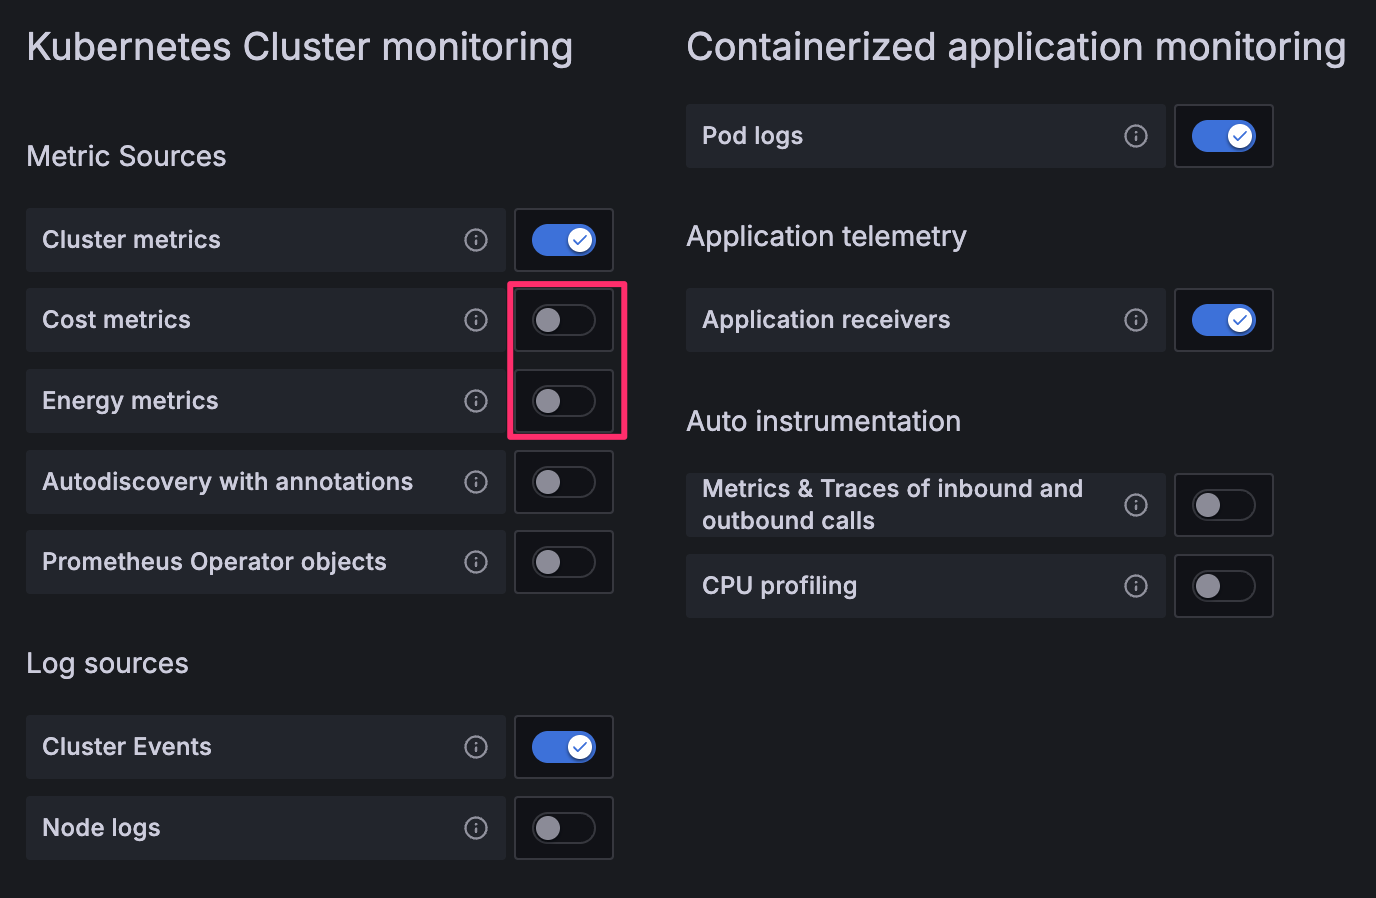
利用する機能についてはデフォルトで Cost metrics (OpenCost) と Energy metrics (Keplr) が有効になっていますが、個人的には必要性を感じなかったので無効にしています。
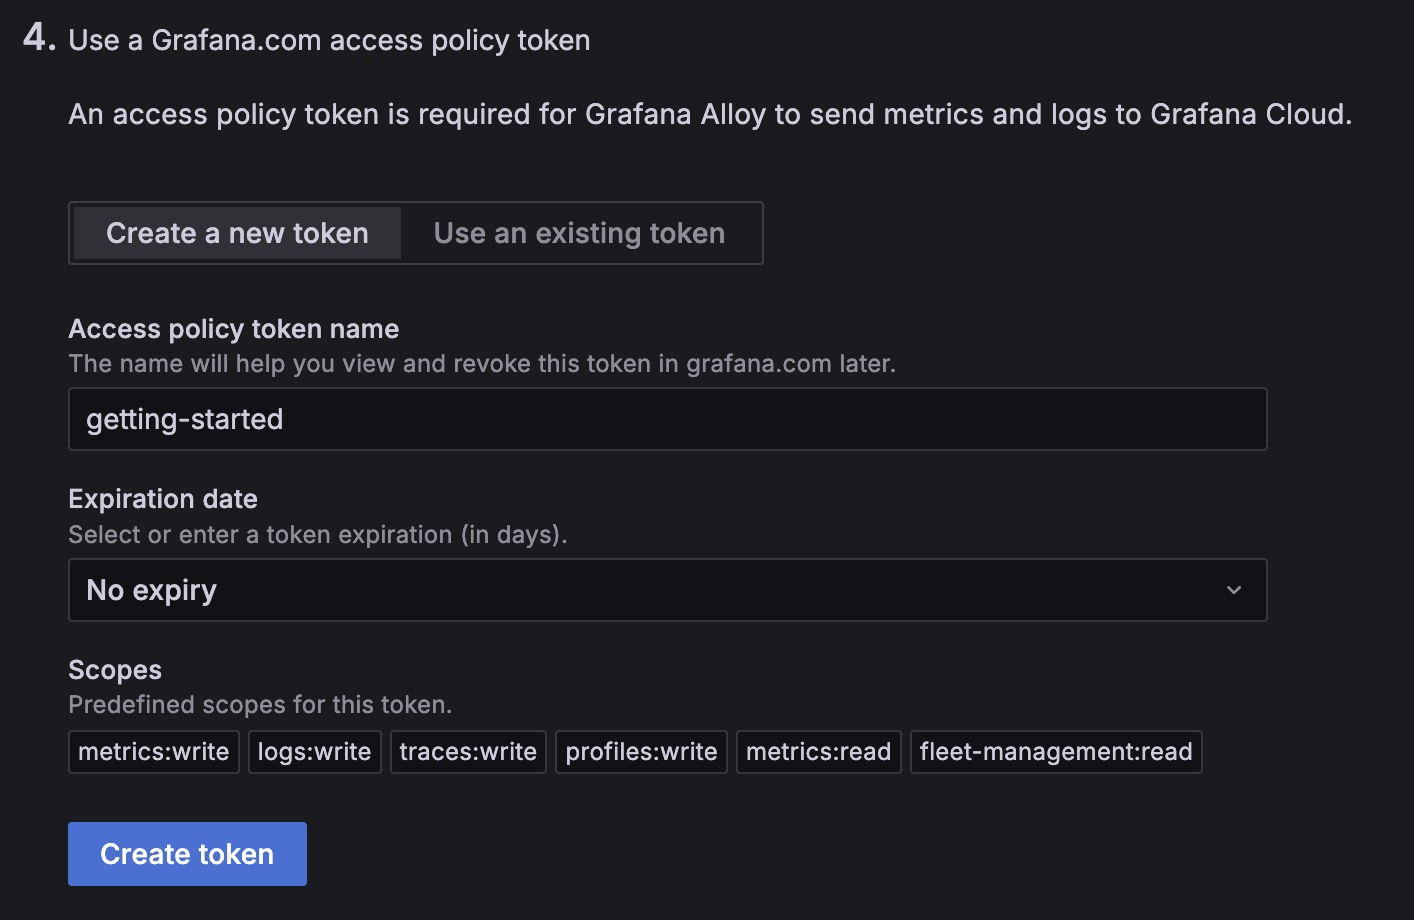
今回は初めての利用なので新規作成します。これによって access policy とそれに紐付く token が作成されます。access policy の scope は自動で設定されますが、後ほど変更可能です。token の expiration date は後から変更できないようなので、変更したくなったら既存の token を削除して新規作成することになります。
Fleet Management はデフォルトで有効化されているんですが、とりあえず 1 クラスタで利用する分には不要そうなので無効化します。複数クラスタを管理する場合に重宝するかもしれません。
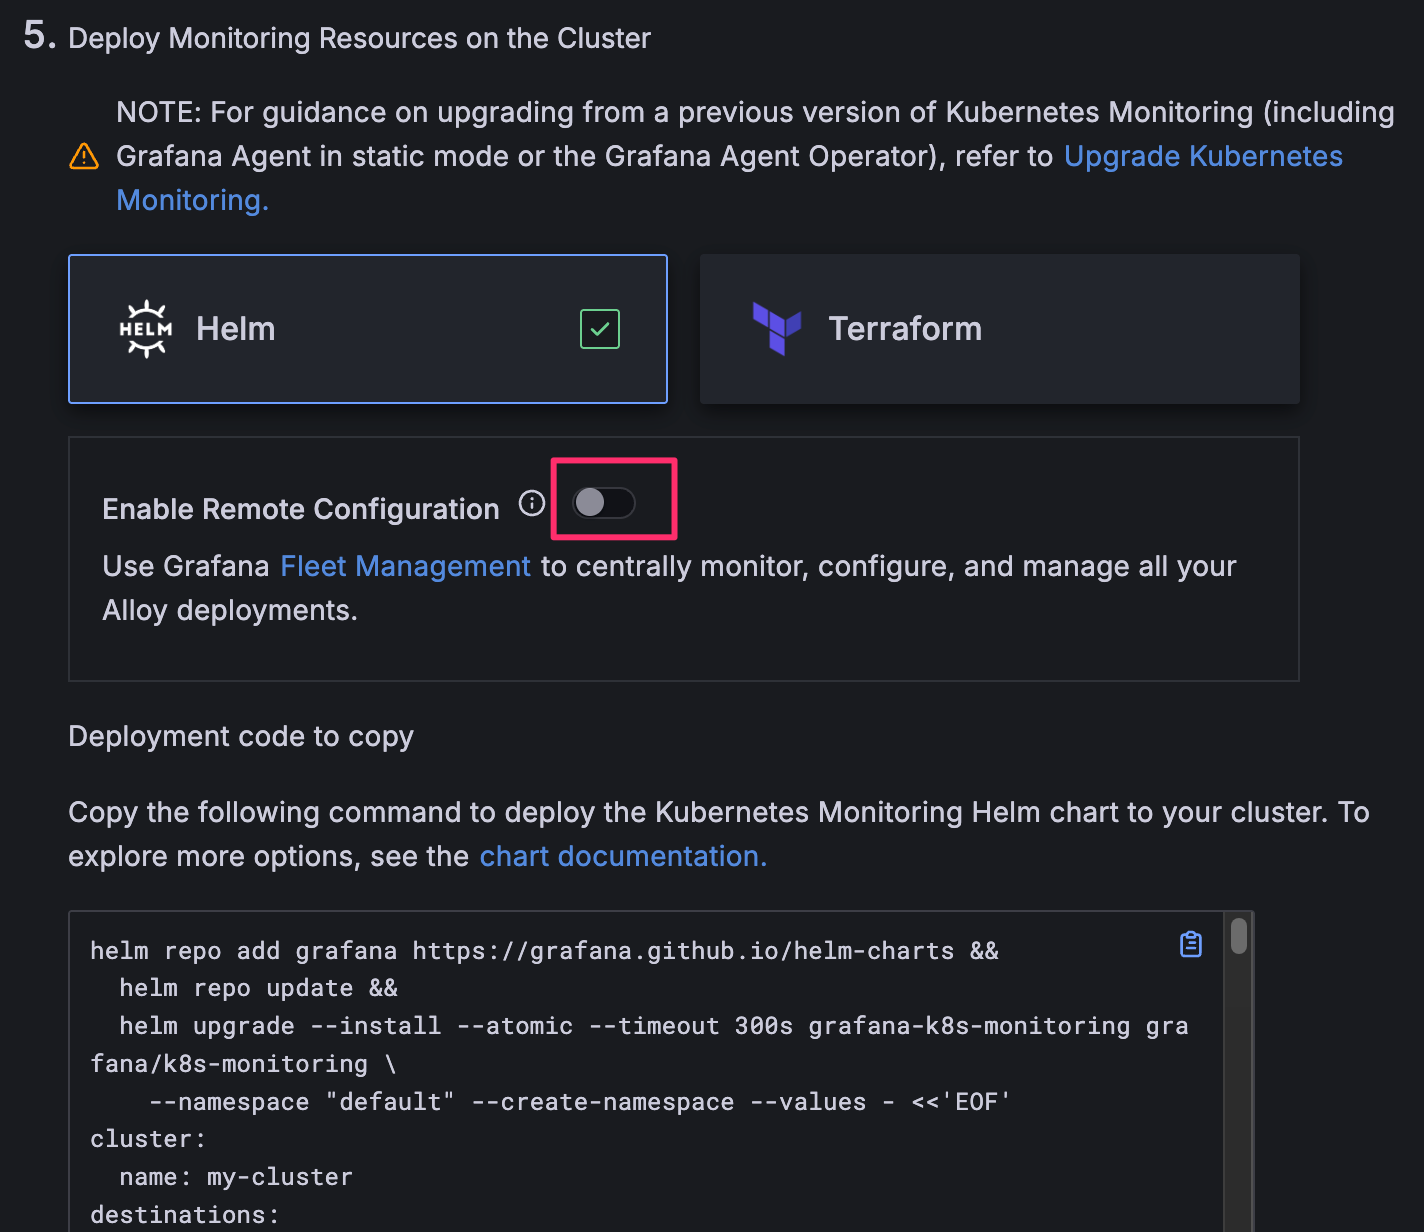
あとは表示されたコマンドを実行するだけで Alloy がインストールされ、クラスタのログやメトリクスが収集されて Grafana 上で見れるようになります。
2025-09-24 時点だと values の内容のみを抜粋すると次のような内容になりました。url, username, password はプレースホルダーにしてあります。
cluster:
  name: my-cluster
destinations:
  - name: grafana-cloud-metrics
    type: prometheus
    url: $PROMETHEUS_REMOTE_WRITE_ENDPOINT
    auth:
      type: basic
      username: "$PROMETHEUS_USERNAME"
      password: $GRAFANA_CLOUD_TOKEN
  - name: grafana-cloud-logs
    type: loki
    url: $LOKI_ENDPOINT
    auth:
      type: basic
      username: "$LOKI_USERNAME"
      password: $GRAFANA_CLOUD_TOKEN
  - name: gc-otlp-endpoint
    type: otlp
    url: $OTLP_ENDPOINT
    protocol: http
    auth:
      type: basic
      username: "$GRAFANA_INSTANCE_ID"
      password: $GRAFANA_CLOUD_TOKEN
    metrics:
      enabled: true
    logs:
      enabled: true
    traces:
      enabled: true
clusterMetrics:
  enabled: true
  kube-state-metrics:
    podAnnotations:
      kubernetes.azure.com/set-kube-service-host-fqdn: "true"
clusterEvents:
  enabled: true
podLogs:
  enabled: true
applicationObservability:
  enabled: true
  receivers:
    otlp:
      grpc:
        enabled: true
        port: 4317
      http:
        enabled: true
        port: 4318
    zipkin:
      enabled: true
      port: 9411
integrations:
  alloy:
    instances:
      - name: alloy
        labelSelectors:
          app.kubernetes.io/name:
            - alloy-metrics
            - alloy-singleton
            - alloy-logs
            - alloy-receiver
alloy-metrics:
  enabled: true
  controller:
    podAnnotations:
      kubernetes.azure.com/set-kube-service-host-fqdn: "true"
alloy-singleton:
  enabled: true
  controller:
    podAnnotations:
      kubernetes.azure.com/set-kube-service-host-fqdn: "true"
alloy-logs:
  enabled: true
  controller:
    podAnnotations:
      kubernetes.azure.com/set-kube-service-host-fqdn: "true"
alloy-receiver:
  enabled: true
  alloy:
    extraPorts:
      - name: otlp-grpc
        port: 4317
        targetPort: 4317
        protocol: TCP
      - name: otlp-http
        port: 4318
        targetPort: 4318
        protocol: TCP
      - name: zipkin
        port: 9411
        targetPort: 9411
        protocol: TCP
  controller:
    podAnnotations:
      kubernetes.azure.com/set-kube-service-host-fqdn: "true"
もし kustomize を使ってインストールする場合は includeCRDs と skipHooks に true を指定する必要があることに注意してください。
helmCharts:
- name: k8s-monitoring
  repo: https://grafana.github.io/helm-charts
  version: 3.5.1
  namespace: alloy
  releaseName: grafana-k8s-monitoring
  valuesFile: values.yaml
  includeCRDs: true
  skipHooks: true
includeCRDs を指定しないと次のようなエラーになります。
resource mapping not found for name: "release-name-alloy-logs" namespace: "alloy" from "STDIN": no matches for kind "Alloy" in version "collectors.grafana.com/v1alpha1"
ensure CRDs are installed first
resource mapping not found for name: "release-name-alloy-metrics" namespace: "alloy" from "STDIN": no matches for kind "Alloy" in version "collectors.grafana.com/v1alpha1"
ensure CRDs are installed first
resource mapping not found for name: "release-name-alloy-receiver" namespace: "alloy" from "STDIN": no matches for kind "Alloy" in version "collectors.grafana.com/v1alpha1"
ensure CRDs are installed first
resource mapping not found for name: "release-name-alloy-singleton" namespace: "alloy" from "STDIN": no matches for kind "Alloy" in version "collectors.grafana.com/v1alpha1"
ensure CRDs are installed first
skipHooks を指定しないと、Helm chart の pre-delete hook として登録されている Job が普通の Job とみなされて即実行されます。その結果、2 回目の kubectl apply 時に Alloy custom resource (alloys.collectors.grafana.com) が全て削除されます。hook がないことで、kubectl delete の際に次のようにして finalizer を削除する必要がありますが、削除時以外には影響がないので大きな問題にはならないでしょう。
for name in $(kubectl get -n alloy alloys.collectors.grafana.com -o 'jsonpath={.items[*].metadata.name}'); do
  kubectl patch \
    --namespace=alloy \
    --type json \
    --patch='[{"op": "remove", "path": "/metadata/finalizers"}]' \
    alloy.collectors.grafana.com/$name
done
以降、Getting Started Guide のインストールコマンドに従って Helm chart の release name を grafana-k8s-monitoring にしたものとします。
Alloy とは何か?
Getting Started Guide ではしれっと Alloy が出てきましたが、Alloy は OpenTelemetry Collector みたいなものです。
Introductoin to Grafana Alloy には “Alloy is a flexible, high performance, vendor-neutral distribution of the OpenTelemetry Collector.” とありますが、ソースコードから設定ファイルの構文まで OpenTelemetry Collector とは全く異なるものなので、Grafana Labs 製独自 OpenTelemetry Collector と考えると良いでしょう。
元々 Grafana Agent の Flow mode というものがあり、Alloy はこれの後継にあたるようです。GitHub のスター数では Grafana Agent は OpenTelemetry に対して差が開く一方でしたが、Alloy は平衡状態にあるようです。
Alloy と OpenTelemetry Collector の違いは grafana/agent#642 (comment) がよく説明してそうで、Alloy は Prometheus のエコシステムにフォーカスしているのに対して、OpenTelemetry Collector はスコープがもっと広くなっています。また、OpenTelemetry Collector は独自のコンポーネント含め、必要なコンポーネントのみから collector をビルドする仕組みを提供していますが1、Alloy で同様のことをしようと思うと fork するしかなさそうです。
とはいえ、Configure Kubernetes Monitoring にも次のように書いてあるように、特別な事情がなければ Grafana Cloud を利用する分には OpenTelemetry Collector ではなく Alloy を利用するのが無難でしょう。
Configuration with Grafana Kubernetes Monitoring Helm chart is recommended.
設定ファイルの構文が特殊ですが、Terraform に似た構文なので、Terraform に慣れている人であれば Alloy configuration syntax を読んで Grafana Alloy tutorials をやれば、Helm chart でインストールされた設定ファイルを読み解くことは可能かと思います。
Helm chart の values を理解する
Helm chart を使って Alloy をインストールすると様々なコンポーネントがインストールされるんですが、何がインストールされるか理解するには Overview of Grafana Kubernetes Monitoring Helm chart を一読するのが良いです。記事中の overview の図からもわかるように、Grafana Kubernetes Monitoring Helm chart を使うと少なくとも次の 4 種類の collector がインストールされます。
- alloy-logs: Pod などのログ収集用
- alloy-metrics: メトリクス収集用
- alloy-receiver: OTLP receiver で受け取るデータ用
- alloy-singleton: Kubernetes event 等 cluster レベルのデータ収集用
Getting Started Guide で生成された values のトップレベルにも上記のフィールドが定義されているため、それらが collector の定義に関係していることは想像が付くかと思います。values によってどのようなカスタマイズができるかは Customize the Kubernetes Monitoring Helm chart を読むとイメージが掴めるでしょう。
また、次のコマンドの出力結果には要所要所に README へのリンクが記載されているので、values に記載されている内容の意味を知りたい場合に重宝します。colloector (alloy-*) の設定値に関してはリンク先が間違っていて Grafana Alloy collector reference が正しいので注意が必要ですが。
helm show values grafana/k8s-monitoring
このように、ドキュメントはそれなりに充実しているわけですが、config.alloy の内容を変更したい場合にどの値を変更すれば良いか初見で理解するのはなかなか大変です。運良くドキュメントや examples から求めている内容が見つかれば良いですが、そうでなければ template を読み解く必要があります。例えば、以下は grafana-k8s-monitoring-alloy-logs ConfigMap の定義ですが、loki.process.pod_logs に処理を追加したい場合にどのように values を変更すべきか特定するのは至難の業です。
# Source: k8s-monitoring/templates/alloy-config.yaml
apiVersion: v1
kind: ConfigMap
metadata:
  name: grafana-k8s-monitoring-alloy-logs
  namespace: alloy
data:
  config.alloy: |
    // Feature: Pod Logs
    declare "pod_logs" {
      argument "logs_destinations" {
        comment = "Must be a list of log destinations where collected logs should be forwarded to"
      }

      // -- snip --

      loki.process "pod_logs" {
        stage.match {
          selector = "{tmp_container_runtime=~\"containerd|cri-o\"}"
          // the cri processing stage extracts the following k/v pairs: log, stream, time, flags
          stage.cri {}

          // Set the extract flags and stream values as labels
          stage.labels {
            values = {
              flags  = "",
              stream  = "",
            }
          }
        }

        stage.match {
          selector = "{tmp_container_runtime=\"docker\"}"
          // the docker processing stage extracts the following k/v pairs: log, stream, time
          stage.docker {}

          // Set the extract stream value as a label
          stage.labels {
            values = {
              stream  = "",
            }
          }
        }

        // Drop the filename label, since it's not really useful in the context of Kubernetes, where we already have cluster,
        // namespace, pod, and container labels. Drop any structured metadata. Also drop the temporary
        // container runtime label as it is no longer needed.
        stage.label_drop {
          values = [
            "filename",
            "tmp_container_runtime",
          ]
        }
        stage.structured_metadata {
          values = {
            "k8s_pod_name" = "k8s_pod_name",
            "pod" = "pod",
            "service_instance_id" = "service_instance_id",
          }
        }

        // Only keep the labels that are defined in the `keepLabels` list.
        stage.label_keep {
          values = ["__tenant_id__","app_kubernetes_io_name","container","instance","job","level","namespace","service_name","service_namespace","deployment_environment","deployment_environment_name","k8s_namespace_name","k8s_deployment_name","k8s_statefulset_name","k8s_daemonset_name","k8s_cronjob_name","k8s_job_name","k8s_node_name"]
        }

        forward_to = argument.logs_destinations.value
      }
    }
    pod_logs "feature" {
      logs_destinations = [
        loki.write.grafana_cloud_logs.receiver,
      ]
    }

    // -- snip --
Pod のログを収集している Alloy の設定だからと Grafana Alloy collector reference を確認してもそれらしい設定値は見つかりません。
“Source: k8s-monitoring/templates/alloy-config.yaml” と記載されていることから k8s-monitoring/templates/alloy-config.yaml から生成されていることは容易に想像が付くのですが、これを読み解くのはなかなか大変です。JetBrains 製の IDE であれば include 対象の定義にジャンプできるので、IDE を使って処理を追いかければ理解が捗るかもしれません。このご時世だと AI も駆使できるかもしれません。
他の手段としては愚直に grep ですね。今回の場合、loki.process "pod_logs" で grep すればテンプレートファイルがすぐ見つかり、このファイルの中で extraLogProcessingStages という value が使われていることがわかります。
$ git grep 'loki.process "pod_logs"' charts/k8s-monitoring ':!*/docs/*' ':!*/tests/*'
charts/k8s-monitoring/charts/feature-pod-logs/templates/_common_log_processing.alloy.tpl:2:loki.process "pod_logs" {
あとは extraLogProcessingStages でドキュメントを漁れば使用例が出てきます。
$ git grep extraLogProcessingStages charts/k8s-monitoring/docs/examples
charts/k8s-monitoring/docs/examples/extra-rules/README.md:16:*   `extraLogProcessingStages` - Rules that control log processing, such as modifying labels or modifying content.
charts/k8s-monitoring/docs/examples/extra-rules/README.md:98:  extraLogProcessingStages: |-
charts/k8s-monitoring/docs/examples/extra-rules/description.txt:12:*   `extraLogProcessingStages` - Rules that control log processing, such as modifying labels or modifying content.
charts/k8s-monitoring/docs/examples/extra-rules/values.yaml:77:  extraLogProcessingStages: |-
charts/k8s-monitoring/docs/examples/log-metrics/README.md:32:  extraLogProcessingStages: |-
charts/k8s-monitoring/docs/examples/log-metrics/values.yaml:17:  extraLogProcessingStages: |-
なお、loki.process.pod_logs に設定を追加する方法に関しては Customize the Kubernetes Monitoring Helm chart をよく読めば答えにたどり着くことはできて、Processing and labeling の Additional processing で紹介されています。
loki.process.pod_logs に設定を追加する方法がわかっても、どのような設定を追加すれば意図したとおりにログを処理できるかという新たな問題が出てきますが、それについてはこの記事の範疇を超えるので、別途詳説 Alloy loki.processにまとめています。
今回は values の各設定項目のドキュメントや変更すべき設定項目の探し方について説明しましたが、設定項目を変更した際の差分の確認方法や反映方法にはついては後編で扱います。
Grafana Cloud の token 管理
Helm chart のインストール時には Grafana Cloud の token を指定する必要があります。この情報から Kubernetes 上に Secret が作成され、config.alloy ではこの Secret を利用するようになっています。
ところが、Alloy の管理を Argo CD などで行おうと思うと、token 情報を直接 values に指定することは避けたいものです。
Destinations のドキュメントには各 type のドキュメントへのリンクがあり、どの type も secret.create に false を指定することで Helm chart の Secret 作成処理をスキップできることがわかります。
destinations:
  - name: grafana-cloud-metrics
    type: prometheus
    url: $PROMETHEUS_REMOTE_WRITE_ENDPOINT
    auth:
      type: basic
    secret:
      create: false
  - name: grafana-cloud-logs
    type: loki
    url: $LOKI_ENDPOINT
    auth:
      type: basic
    secret:
      create: false
  - name: gc-otlp-endpoint
    type: otlp
    url: $OTLP_ENDPOINT
    protocol: http
    auth:
      type: basic
    secret:
      create: false
    metrics:
      enabled: true
    logs:
      enabled: true
    traces:
      enabled: true
examples/auth/external-secrets も参考になるかと思います。
あとは各組織の Secret の管理方法に従うと良いでしょう。
AKS における Secret 管理の例: Kubernetes Secret を作成する Deployment の導入
例えば、AKS (Azure Kubernetes Service) の場合、Key Vault の secret と Kubernetes の Secret を連携させることができます。
cf. Connect your Azure identity provider to the Azure Key Vault Secrets Store CSI Driver in Azure Kubernetes Service (AKS)
以下の Terraform ファイルはそのために必要な managed identity や federated identity credential を作成する例です。
terraform {
  required_version = ">=1.11"
  required_providers {
    azurekv = {
      source = "abicky/azurekv"
    }
  }
}

data "azurerm_subscription" "default" {}

resource "azurerm_key_vault" "this" {
  name                = random_string.name.result
  location            = var.location
  resource_group_name = var.resource_group_name
  tenant_id           = data.azurerm_subscription.default.tenant_id
  sku_name            = "standard"

  enable_rbac_authorization = true
}

resource "azurekv_secret" "this" {
  for_each = toset([
    "prometheus-username",
    "loki-username",
    "grafana-instance-id",
    "grafana-cloud-token",
  ])

  name             = each.key
  key_vault_id     = azurerm_key_vault.this.id
  value_wo         = "This value is manged outside of Terraform"
  value_wo_version = 1
}

resource "azurerm_user_assigned_identity" "alloy_secret_creator" {
  name                = "alloy-secret-creator"
  location            = var.location
  resource_group_name = var.resource_group_name
}

resource "azurerm_role_assignment" "alloy_secret_creator" {
  principal_id         = azurerm_user_assigned_identity.alloy_secret_creator.principal_id
  role_definition_name = "Key Vault Secrets User"
  scope                = azurerm_key_vault.this.id
}

resource "azurerm_federated_identity_credential" "alloy_secret_creator" {
  name                = "aks"
  resource_group_name = var.resource_group_name
  audience            = ["api://AzureADTokenExchange"]
  issuer              = var.kubernetes_cluster_oidc_issuer_url
  parent_id           = azurerm_user_assigned_identity.alloy_secret_creator.id
  subject             = "system:serviceaccount:alloy:${azurerm_user_assigned_identity.alloy_secret_creator.name}"
}
Key Vault の secret を Kubernetes の Secret として作成するには Key Vault の secret を mount する container が最低 1 つは存在していないといけないので、例えば次のように sleep infinity する Pod の Deployment を作成すると Kuberntes の Secret を維持できます。
apiVersion: secrets-store.csi.x-k8s.io/v1
kind: SecretProviderClass
metadata:
  name: alloy-secret-provider
spec:
  provider: azure
  parameters:
    usePodIdentity: "false"
    clientID: "$USER_ASSIGNED_CLIENT_ID"
    keyvaultName: $KEYVAULT_NAME
    objects:  |
      array:
        - |
          objectName: prometheus-username
          objectType: secret
        - |
          objectName: loki-username
          objectType: secret
        - |
          objectName: grafana-instance-id
          objectType: secret
        - |
          objectName: grafana-cloud-token
          objectType: secret
    tenantId: "$TENANT_ID"
  # cf. https://learn.microsoft.com/en-us/azure/aks/csi-secrets-store-configuration-options#sync-mounted-content-with-a-kubernetes-secret
  secretObjects:
  - data:
    - key: username
      objectName: prometheus-username
    - key: password
      objectName: grafana-cloud-token
    secretName: grafana-cloud-metrics-grafana-k8s-monitoring
    type: Opaque
  - data:
    - key: username
      objectName: loki-username
    - key: password
      objectName: grafana-cloud-token
    secretName: grafana-cloud-logs-grafana-k8s-monitoring
    type: Opaque
  - data:
    - key: username
      objectName: grafana-instance-id
    - key: password
      objectName: grafana-cloud-token
    secretName: gc-otlp-endpoint-grafana-k8s-monitoring
    type: Opaque
---
apiVersion: v1
kind: ServiceAccount
metadata:
  name: alloy-secret-creator
  annotations:
    azure.workload.identity/client-id: $USER_ASSIGNED_CLIENT_ID
automountServiceAccountToken: false
---
apiVersion: apps/v1
kind: Deployment
metadata:
  name: alloy-secret-creator
  labels:
    app: alloy-secret-creator
spec:
  replicas: 1
  selector:
    matchLabels:
      app: alloy-secret-creator
  template:
    metadata:
      labels:
        app: alloy-secret-creator
        azure.workload.identity/use: "true"
    spec:
      containers:
      - name: main
        image: alpine
        command:
        - sleep
        - infinity
        volumeMounts:
        - name: secrets
          mountPath: "/mnt/secrets-store"
          readOnly: true
      terminationGracePeriodSeconds: 0
      serviceAccountName: alloy-secret-creator
      volumes:
      - name: secrets
        csi:
          driver: secrets-store.csi.k8s.io
          readOnly: true
          volumeAttributes:
            secretProviderClass: alloy-secret-provider
AKS における Secret 管理の例: 各 Alloy が Kubernetes Secret を作成
先ほどは、Key Vault の secret を Kubernetes の Secret として作成するには Key Vault の secret を mount する container が最低 1 つは存在していないといけないという特性を考慮し、sleep infinity する Pod の Deployment を作成しました。
この方法は Helm chart とは独立に導入できる一方で、無駄な Deployment を導入することになります。
AKS の SecretProviderClass を使うことを前提とするなら、各 Alloy の container が secret を mount するように Helm chart の values を修正する方が自然でしょう。
各 Alloy の container が secret を mount するには、Alloy で使われている全ての service account 用の federated identity credential を作成するように Terraform ファイルを変更する必要があります。
resource "azurerm_user_assigned_identity" "alloy" {
  name                = "alloy"
  location            = var.location
  resource_group_name = var.resource_group_name
}

resource "azurerm_role_assignment" "alloy" {
  principal_id         = azurerm_user_assigned_identity.alloy.principal_id
  role_definition_name = "Key Vault Secrets User"
  scope                = azurerm_key_vault.this.id
}

resource "azurerm_federated_identity_credential" "alloy" {
  for_each = { for name in [
    "grafana-k8s-monitoring-alloy-metrics",
    "grafana-k8s-monitoring-alloy-logs",
    "grafana-k8s-monitoring-alloy-receiver",
    "grafana-k8s-monitoring-alloy-singleton",
  ] : name => name }

  name                = each.key
  resource_group_name = var.resource_group_name
  audience            = ["api://AzureADTokenExchange"]
  issuer              = var.kubernetes_cluster_oidc_issuer_url
  parent_id           = azurerm_user_assigned_identity.alloy.id
  subject             = "system:serviceaccount:alloy:${each.key}"
}
その上で、各 Alloy の設定で secret を mount するようにします。具体的には Helm chart の values を以下のように設定します。SecretProviderClass は先ほど作成したものを流用しています。
alloy-metrics:
  enabled: true
  alloy:
    mounts:
      extra:
        - name: secrets
          mountPath: "/mnt/secrets-store"
          readOnly: true
  controller:
    podAnnotations:
      kubernetes.azure.com/set-kube-service-host-fqdn: "true"
    volumes:
      extra:
        - name: secrets
          csi:
            driver: secrets-store.csi.k8s.io
            readOnly: true
            volumeAttributes:
              secretProviderClass: alloy-secret-provider
  serviceAccount:
    annotations:
      azure.workload.identity/client-id: $USER_ASSIGNED_CLIENT_ID
alloy-singleton:
  enabled: true
  alloy:
    mounts:
      extra:
        - name: secrets
          mountPath: "/mnt/secrets-store"
          readOnly: true
  controller:
    podAnnotations:
      kubernetes.azure.com/set-kube-service-host-fqdn: "true"
    volumes:
      extra:
        - name: secrets
          csi:
            driver: secrets-store.csi.k8s.io
            readOnly: true
            volumeAttributes:
              secretProviderClass: alloy-secret-provider
  serviceAccount:
    annotations:
      azure.workload.identity/client-id: $USER_ASSIGNED_CLIENT_ID
alloy-logs:
  enabled: true
  alloy:
    mounts:
      extra:
        - name: secrets
          mountPath: "/mnt/secrets-store"
          readOnly: true
  controller:
    podAnnotations:
      kubernetes.azure.com/set-kube-service-host-fqdn: "true"
    volumes:
      extra:
        - name: secrets
          csi:
            driver: secrets-store.csi.k8s.io
            readOnly: true
            volumeAttributes:
              secretProviderClass: alloy-secret-provider
  serviceAccount:
    annotations:
      azure.workload.identity/client-id: $USER_ASSIGNED_CLIENT_ID
alloy-receiver:
  enabled: true
  alloy:
    extraPorts:
      - name: otlp-grpc
        port: 4317
        targetPort: 4317
        protocol: TCP
      - name: otlp-http
        port: 4318
        targetPort: 4318
        protocol: TCP
    mounts:
      extra:
        - name: secrets
          mountPath: "/mnt/secrets-store"
          readOnly: true
  controller:
    podAnnotations:
      kubernetes.azure.com/set-kube-service-host-fqdn: "true"
    volumes:
      extra:
        - name: secrets
          csi:
            driver: secrets-store.csi.k8s.io
            readOnly: true
            volumeAttributes:
              secretProviderClass: alloy-secret-provider
  serviceAccount:
    annotations:
      azure.workload.identity/client-id: $USER_ASSIGNED_CLIENT_ID