詳説 Grafana Alloy loki.process

とりあえず Grafana Alloy を使って Loki にログを送ってみるだけなら Use Grafana Alloy to send logs to Loki と Logs and relabeling basics in Grafana Alloy をやれば雰囲気を掴むことができるんですが、ログをフィルタリングしたり加工したりするには loki.process の理解が欠かせません。livedebugging を使えば loki.process の input と output の情報は確認できますが、loki.process 内の各 stage でどのような処理が行われたかは確認することができません。log level を debug にしても同様です。そのこともあって、ドキュメントを読みつつ設定を変更して試行錯誤しても自分には使い方がいまいち理解できず、ソースコードを読んだりしてようやく理解できたので、理解した内容についてまとめました。
loki.process の基礎知識
loki.process については前身である Promtail の pipeline のドキュメントを読むことで理解が深まります。
次の引用はドキュメントの冒頭部分であり、特に重要な内容です。
A pipeline is used to transform a single log line, its labels, and its timestamp. A pipeline is comprised of a set of stages. There are 4 types of stages:
- Parsing stages parse the current log line and extract data out of it. The extracted data is then available for use by other stages.
- Transform stages transform extracted data from previous stages.
- Action stages take extracted data from previous stages and do something with them. Actions can:
- Add or modify existing labels to the log line
- Change the timestamp of the log line
- Change the content of the log line
- Create a metric based on the extracted data
- Filtering stages optionally apply a subset of stages or drop entries based on some condition.
例えば、stage.json は parsing stage に相当し、データを抽出するだけなので、この stage だけを使っても Loki に取り込まれるデータは変わりません。stage.cri のように、複数の stage をひとまとめにした stage も存在します。このように、利用する stage がどの種類の stage に相当するのか意識することが重要です。
ログには様々なデータが含まれていて、各 stage で特に意識しなければいけないのは次の 3 種類のデータです。
- log line
- labels
- extracted data
これらのデータがあることを意識していなければドキュメントを読んでも内容を理解するのは難しいでしょう。
それでは、それぞれのデータについて説明していきます。
Log line
log line は文字通り 1 行のログを意味します。例えば、Kubernetes の Pod が Hello World! というログを stdout に出力した場合、CRI log format だと次のようなデータが log line になります。
2025-09-26T10:03:07.408766429Z stdout F Hello World!
log line は、例えば stage.json や stage.drop で使われていて、source が指定されていない場合は log line を対象に処理が行われます。
また、transform stage である stage.output で log line を書き換えることもできます。
Labels
labels はいわゆる Loki の labels です。例えば loki.source.file では filename label が付与されます。
discovery.kubernetes の pod role であれば __meta_kubernetes_namespace label などが付与されます。
labels は、loki.process 内において例えば stage.match の selector で処理対象のログをフィルタリングするのに使われます。stage.labels で extracted data の値を labels に追加することもできます。
Extracted data
extracted data は loki.process 内でのみ使われるデータですが、非常に重要な概念です。loki.process のドキュメント内では shared map、extracted values、extracted map 等などと表現されていますが、ここでは extracted data で統一します。
ここでは、extracted data を説明するために、stage.output で使われている次の設定を利用します。
stage.json {
  expressions = { "user" = "user", "message" = "message" }
}

stage.labels {
  values = { "user" = "user" }
}

stage.output {
  source = "message"
}
この設定の下、{"user": "John Doe", "message": "hello, world!"} という log line の入力があったとします。初期状態は次のとおりです。
log_line: {"user": "John Doe", "message": "hello, world!"}
labels: {}
extracted_data: {}
これが stage.json の設定によって log line の JSON に含まれる user フィールドと message フィールドが、それぞれ extracted data の user フィールドと message フィールドに抽出されるので、次のような状態になります。
log_line: {"user": "John Doe", "message": "hello, world!"}
labels: {}
extracted_data: {"user": "John Doe", "message": "hello, world!"}
stage.labels の設定では、extracted data の user フィールドを labels の user フィールドとして付与するので次のような状態になります。
log_line: {"user": "John Doe", "message": "hello, world!"}
labels: {"user": "John Doe"}
extracted_data: {"user": "John Doe", "message": "hello, world!"}
最後に stage.output の設定によって log line が extracted data の message フィールドの値に書き換えられるので次のような状態になります。
log_line: hello, world!
labels: {"user": "John Doe"}
extracted_data: {"user": "John Doe", "message": "hello, world!"}
実践的な例
loki.process の基礎を押さえたところで、実践的な例についていくつか紹介します。
JSON のログに特定のフィールドが含まれていれば drop する
例えば trace データとログを紐付けるために OTLP receiver に TraceID 付きのログを送りつつ、kubectl logs でもログを確認できるようにするために同じログを standard output log exporter を使って stdout に出力するケースを考えます。
stdout に出力されるログの例
{"Timestamp":"2025-09-28T09:03:51.787320833Z","ObservedTimestamp":"2025-09-28T09:03:51.787324124Z","Severity":9,"SeverityText":"INFO","Body":{"Type":"String","Value":"Hello World!"},"Attributes":[{"Key":"key1","Value":{"Type":"String","Value":"value1"}}],"TraceID":"4f4758e0dbacc537e87d9f09c5102d59","SpanID":"0b2f8bd6cadae160","TraceFlags":"01","Resource":[{"Key":"service.name","Value":{"Type":"STRING","Value":"hello"}},{"Key":"service.version","Value":{"Type":"STRING","Value":"0.0.1"}},{"Key":"telemetry.sdk.language","Value":{"Type":"STRING","Value":"go"}},{"Key":"telemetry.sdk.name","Value":{"Type":"STRING","Value":"opentelemetry"}},{"Key":"telemetry.sdk.version","Value":{"Type":"STRING","Value":"1.38.0"}}],"Scope":{"Name":"github.com/abicky/opentelemetry-collector-k8s-example","Version":"","SchemaURL":"","Attributes":{}},"DroppedAttributes":0}
上記のログは次のコマンドを実行した時に stdout に出力されたものです。
kubectl run hello-otel-$(date '+%s') --restart=Never -i \
  --image=ghcr.io/abicky/opentelemetry-collector-k8s-example/hello-otel@sha256:7428942bb1ad8a9cdc655684554c05e81ddf46ff93a7fe9a2930c4f7eb47603f \
  --env=OTEL_LOGS_EXPORTER=console
この場合、Loki へは OTLP receiver で受け取ったログのみ転送し、stdout に出力されたログは Alloy で drop すると良いでしょう。
OpenTelemetry のログは Log and Event Record Definition に定められたフィールドを含むため、例えば ObservedTimestamp を含むログを drop するとします。これは stage.json と stage.drop を組み合わせることで実現できます。
loki.process "main" {
  stage.json {
    expressions = {observed_timestamp = "ObservedTimestamp"}
  }

  stage.drop {
    source = "observed_timestamp"
  }

  forward_to = [loki.echo.debug.receiver]
}

loki.echo "debug" {}
stage.drop は、source が指定されいて、かつ expression が指定されていない場合、extracted data に source で指定したフィールドが存在すれば drop するようになっています。
cf. loki/process/stages/drop.go#L150-L169
複数行にまたがる JSON のログに特定のフィールドが含まれていれば drop する
実現したいことは「特定のフィールドを含む JSON のログを drop する」と同じですが、stdout に出力されるデータが pretty print されているケースを考えます。
例として、abicky/opentelemetry-collector-k8s-example/hello-otel を次のように実行した場合に stdout に出力されるログが挙げられます。
kubectl run hello-otel-$(date '+%s') --restart=Never -i \
  --image=ghcr.io/abicky/opentelemetry-collector-k8s-example/hello-otel@sha256:7428942bb1ad8a9cdc655684554c05e81ddf46ff93a7fe9a2930c4f7eb47603f \
  --env=OTEL_LOGS_EXPORTER=console \
  --env=OTEL_EXPORTER_CONSOLE_LOGS_PRETTY_PRINT=true
minikube node に出力されるログの例
{"log":"{\n","stream":"stdout","time":"2025-09-28T09:07:50.902921697Z"}
{"log":"\u0009\"Timestamp\": \"2025-09-28T09:07:50.838311072Z\",\n","stream":"stdout","time":"2025-09-28T09:07:50.902939822Z"}
{"log":"\u0009\"ObservedTimestamp\": \"2025-09-28T09:07:50.838320613Z\",\n","stream":"stdout","time":"2025-09-28T09:07:50.902945363Z"}
{"log":"\u0009\"Severity\": 9,\n","stream":"stdout","time":"2025-09-28T09:07:50.90294653Z"}
{"log":"\u0009\"SeverityText\": \"INFO\",\n","stream":"stdout","time":"2025-09-28T09:07:50.902947488Z"}
{"log":"\u0009\"Body\": {\n","stream":"stdout","time":"2025-09-28T09:07:50.902948405Z"}
{"log":"\u0009\u0009\"Type\": \"String\",\n","stream":"stdout","time":"2025-09-28T09:07:50.902949197Z"}
{"log":"\u0009\u0009\"Value\": \"Hello World!\"\n","stream":"stdout","time":"2025-09-28T09:07:50.902950447Z"}
{"log":"\u0009},\n","stream":"stdout","time":"2025-09-28T09:07:50.902953197Z"}
{"log":"\u0009\"Attributes\": [\n","stream":"stdout","time":"2025-09-28T09:07:50.90295403Z"}
{"log":"\u0009\u0009{\n","stream":"stdout","time":"2025-09-28T09:07:50.902954822Z"}
{"log":"\u0009\u0009\u0009\"Key\": \"key1\",\n","stream":"stdout","time":"2025-09-28T09:07:50.902955572Z"}
{"log":"\u0009\u0009\u0009\"Value\": {\n","stream":"stdout","time":"2025-09-28T09:07:50.902956488Z"}
{"log":"\u0009\u0009\u0009\u0009\"Type\": \"String\",\n","stream":"stdout","time":"2025-09-28T09:07:50.90295728Z"}
{"log":"\u0009\u0009\u0009\u0009\"Value\": \"value1\"\n","stream":"stdout","time":"2025-09-28T09:07:50.902958113Z"}
{"log":"\u0009\u0009\u0009}\n","stream":"stdout","time":"2025-09-28T09:07:50.902958988Z"}
{"log":"\u0009\u0009}\n","stream":"stdout","time":"2025-09-28T09:07:50.902959738Z"}
{"log":"\u0009],\n","stream":"stdout","time":"2025-09-28T09:07:50.902960488Z"}
{"log":"\u0009\"TraceID\": \"d66b7a5221ed43fe20c7febbe85ed99f\",\n","stream":"stdout","time":"2025-09-28T09:07:50.902963363Z"}
{"log":"\u0009\"SpanID\": \"03c04178caaced39\",\n","stream":"stdout","time":"2025-09-28T09:07:50.902964405Z"}
{"log":"\u0009\"TraceFlags\": \"01\",\n","stream":"stdout","time":"2025-09-28T09:07:50.902965238Z"}
{"log":"\u0009\"Resource\": [\n","stream":"stdout","time":"2025-09-28T09:07:50.902966613Z"}
{"log":"\u0009\u0009{\n","stream":"stdout","time":"2025-09-28T09:07:50.902970238Z"}
{"log":"\u0009\u0009\u0009\"Key\": \"service.name\",\n","stream":"stdout","time":"2025-09-28T09:07:50.902973072Z"}
{"log":"\u0009\u0009\u0009\"Value\": {\n","stream":"stdout","time":"2025-09-28T09:07:50.90297603Z"}
{"log":"\u0009\u0009\u0009\u0009\"Type\": \"STRING\",\n","stream":"stdout","time":"2025-09-28T09:07:50.902976947Z"}
{"log":"\u0009\u0009\u0009\u0009\"Value\": \"hello\"\n","stream":"stdout","time":"2025-09-28T09:07:50.90297778Z"}
{"log":"\u0009\u0009\u0009}\n","stream":"stdout","time":"2025-09-28T09:07:50.902978613Z"}
{"log":"\u0009\u0009},\n","stream":"stdout","time":"2025-09-28T09:07:50.902979363Z"}
{"log":"\u0009\u0009{\n","stream":"stdout","time":"2025-09-28T09:07:50.902980113Z"}
{"log":"\u0009\u0009\u0009\"Key\": \"service.version\",\n","stream":"stdout","time":"2025-09-28T09:07:50.902980863Z"}
{"log":"\u0009\u0009\u0009\"Value\": {\n","stream":"stdout","time":"2025-09-28T09:07:50.902981697Z"}
{"log":"\u0009\u0009\u0009\u0009\"Type\": \"STRING\",\n","stream":"stdout","time":"2025-09-28T09:07:50.902982488Z"}
{"log":"\u0009\u0009\u0009\u0009\"Value\": \"0.0.1\"\n","stream":"stdout","time":"2025-09-28T09:07:50.90298328Z"}
{"log":"\u0009\u0009\u0009}\n","stream":"stdout","time":"2025-09-28T09:07:50.902984113Z"}
{"log":"\u0009\u0009},\n","stream":"stdout","time":"2025-09-28T09:07:50.902984822Z"}
{"log":"\u0009\u0009{\n","stream":"stdout","time":"2025-09-28T09:07:50.902985613Z"}
{"log":"\u0009\u0009\u0009\"Key\": \"telemetry.sdk.language\",\n","stream":"stdout","time":"2025-09-28T09:07:50.902986322Z"}
{"log":"\u0009\u0009\u0009\"Value\": {\n","stream":"stdout","time":"2025-09-28T09:07:50.902987197Z"}
{"log":"\u0009\u0009\u0009\u0009\"Type\": \"STRING\",\n","stream":"stdout","time":"2025-09-28T09:07:50.902987947Z"}
{"log":"\u0009\u0009\u0009\u0009\"Value\": \"go\"\n","stream":"stdout","time":"2025-09-28T09:07:50.903011072Z"}
{"log":"\u0009\u0009\u0009}\n","stream":"stdout","time":"2025-09-28T09:07:50.903012988Z"}
{"log":"\u0009\u0009},\n","stream":"stdout","time":"2025-09-28T09:07:50.90301378Z"}
{"log":"\u0009\u0009{\n","stream":"stdout","time":"2025-09-28T09:07:50.903014572Z"}
{"log":"\u0009\u0009\u0009\"Key\": \"telemetry.sdk.name\",\n","stream":"stdout","time":"2025-09-28T09:07:50.903015363Z"}
{"log":"\u0009\u0009\u0009\"Value\": {\n","stream":"stdout","time":"2025-09-28T09:07:50.903016197Z"}
{"log":"\u0009\u0009\u0009\u0009\"Type\": \"STRING\",\n","stream":"stdout","time":"2025-09-28T09:07:50.903016947Z"}
{"log":"\u0009\u0009\u0009\u0009\"Value\": \"opentelemetry\"\n","stream":"stdout","time":"2025-09-28T09:07:50.903018322Z"}
{"log":"\u0009\u0009\u0009}\n","stream":"stdout","time":"2025-09-28T09:07:50.903028072Z"}
{"log":"\u0009\u0009},\n","stream":"stdout","time":"2025-09-28T09:07:50.903029072Z"}
{"log":"\u0009\u0009{\n","stream":"stdout","time":"2025-09-28T09:07:50.903029947Z"}
{"log":"\u0009\u0009\u0009\"Key\": \"telemetry.sdk.version\",\n","stream":"stdout","time":"2025-09-28T09:07:50.903030697Z"}
{"log":"\u0009\u0009\u0009\"Value\": {\n","stream":"stdout","time":"2025-09-28T09:07:50.903031488Z"}
{"log":"\u0009\u0009\u0009\u0009\"Type\": \"STRING\",\n","stream":"stdout","time":"2025-09-28T09:07:50.903032322Z"}
{"log":"\u0009\u0009\u0009\u0009\"Value\": \"1.38.0\"\n","stream":"stdout","time":"2025-09-28T09:07:50.903033113Z"}
{"log":"\u0009\u0009\u0009}\n","stream":"stdout","time":"2025-09-28T09:07:50.903033905Z"}
{"log":"\u0009\u0009}\n","stream":"stdout","time":"2025-09-28T09:07:50.903034655Z"}
{"log":"\u0009],\n","stream":"stdout","time":"2025-09-28T09:07:50.903037572Z"}
{"log":"\u0009\"Scope\": {\n","stream":"stdout","time":"2025-09-28T09:07:50.903038488Z"}
{"log":"\u0009\u0009\"Name\": \"github.com/abicky/opentelemetry-collector-k8s-example\",\n","stream":"stdout","time":"2025-09-28T09:07:50.90303928Z"}
{"log":"\u0009\u0009\"Version\": \"\",\n","stream":"stdout","time":"2025-09-28T09:07:50.903040197Z"}
{"log":"\u0009\u0009\"SchemaURL\": \"\",\n","stream":"stdout","time":"2025-09-28T09:07:50.90304103Z"}
{"log":"\u0009\u0009\"Attributes\": {}\n","stream":"stdout","time":"2025-09-28T09:07:50.903041822Z"}
{"log":"\u0009},\n","stream":"stdout","time":"2025-09-28T09:07:50.903042613Z"}
{"log":"\u0009\"DroppedAttributes\": 0\n","stream":"stdout","time":"2025-09-28T09:07:50.90304353Z"}
{"log":"}\n","stream":"stdout","time":"2025-09-28T09:07:50.903044363Z"}
AKS node に出力されるログの例
2025-09-28T09:15:36.53860237Z stdout F {
2025-09-28T09:15:36.538617329Z stdout F 	"Timestamp": "2025-09-28T09:15:36.525057105Z",
2025-09-28T09:15:36.538620993Z stdout F 	"ObservedTimestamp": "2025-09-28T09:15:36.525061281Z",
2025-09-28T09:15:36.538622777Z stdout F 	"Severity": 9,
2025-09-28T09:15:36.538624689Z stdout F 	"SeverityText": "INFO",
2025-09-28T09:15:36.538626249Z stdout F 	"Body": {
2025-09-28T09:15:36.538627673Z stdout F 		"Type": "String",
2025-09-28T09:15:36.538629257Z stdout F 		"Value": "Hello World!"
2025-09-28T09:15:36.538630681Z stdout F 	},
2025-09-28T09:15:36.538635473Z stdout F 	"Attributes": [
2025-09-28T09:15:36.538636896Z stdout F 		{
2025-09-28T09:15:36.538638232Z stdout F 			"Key": "key1",
2025-09-28T09:15:36.538639528Z stdout F 			"Value": {
2025-09-28T09:15:36.538640856Z stdout F 				"Type": "String",
2025-09-28T09:15:36.538642144Z stdout F 				"Value": "value1"
2025-09-28T09:15:36.538643728Z stdout F 			}
2025-09-28T09:15:36.538645Z stdout F 		}
2025-09-28T09:15:36.53864628Z stdout F 	],
2025-09-28T09:15:36.538647576Z stdout F 	"TraceID": "7ceaa26ff7ac3dfa1e9933d3d0d7222c",
2025-09-28T09:15:36.538648936Z stdout F 	"SpanID": "e984ad987c8f5afa",
2025-09-28T09:15:36.538650208Z stdout F 	"TraceFlags": "01",
2025-09-28T09:15:36.538651512Z stdout F 	"Resource": [
2025-09-28T09:15:36.538652784Z stdout F 		{
2025-09-28T09:15:36.538654056Z stdout F 			"Key": "service.name",
2025-09-28T09:15:36.538655304Z stdout F 			"Value": {
2025-09-28T09:15:36.538656536Z stdout F 				"Type": "STRING",
2025-09-28T09:15:36.538657816Z stdout F 				"Value": "hello"
2025-09-28T09:15:36.538659087Z stdout F 			}
2025-09-28T09:15:36.538660447Z stdout F 		},
2025-09-28T09:15:36.538661703Z stdout F 		{
2025-09-28T09:15:36.538663055Z stdout F 			"Key": "service.version",
2025-09-28T09:15:36.538664335Z stdout F 			"Value": {
2025-09-28T09:15:36.538665591Z stdout F 				"Type": "STRING",
2025-09-28T09:15:36.538666839Z stdout F 				"Value": "0.0.1"
2025-09-28T09:15:36.538668127Z stdout F 			}
2025-09-28T09:15:36.538669351Z stdout F 		},
2025-09-28T09:15:36.538670575Z stdout F 		{
2025-09-28T09:15:36.538671887Z stdout F 			"Key": "telemetry.sdk.language",
2025-09-28T09:15:36.538673135Z stdout F 			"Value": {
2025-09-28T09:15:36.538674623Z stdout F 				"Type": "STRING",
2025-09-28T09:15:36.538675855Z stdout F 				"Value": "go"
2025-09-28T09:15:36.538677103Z stdout F 			}
2025-09-28T09:15:36.538678375Z stdout F 		},
2025-09-28T09:15:36.538679863Z stdout F 		{
2025-09-28T09:15:36.538681334Z stdout F 			"Key": "telemetry.sdk.name",
2025-09-28T09:15:36.538682646Z stdout F 			"Value": {
2025-09-28T09:15:36.538683918Z stdout F 				"Type": "STRING",
2025-09-28T09:15:36.538685166Z stdout F 				"Value": "opentelemetry"
2025-09-28T09:15:36.53868643Z stdout F 			}
2025-09-28T09:15:36.538687702Z stdout F 		},
2025-09-28T09:15:36.538688942Z stdout F 		{
2025-09-28T09:15:36.538690222Z stdout F 			"Key": "telemetry.sdk.version",
2025-09-28T09:15:36.538691502Z stdout F 			"Value": {
2025-09-28T09:15:36.538692798Z stdout F 				"Type": "STRING",
2025-09-28T09:15:36.538694142Z stdout F 				"Value": "1.38.0"
2025-09-28T09:15:36.538695486Z stdout F 			}
2025-09-28T09:15:36.538696902Z stdout F 		}
2025-09-28T09:15:36.538698198Z stdout F 	],
2025-09-28T09:15:36.53869959Z stdout F 	"Scope": {
2025-09-28T09:15:36.53870135Z stdout F 	"Name": "github.com/abicky/opentelemetry-collector-k8s-example",
2025-09-28T09:15:36.538702646Z stdout F 		"Version": "",
2025-09-28T09:15:36.538703917Z stdout F 		"SchemaURL": "",
2025-09-28T09:15:36.538705277Z stdout F 		"Attributes": {}
2025-09-28T09:15:36.538706853Z stdout F 	},
2025-09-28T09:15:36.538708093Z stdout F 	"DroppedAttributes": 0
2025-09-28T09:15:36.538709485Z stdout F }
stage.cri には partial line のログを concat する仕組みがあるので、複数行に渡る JSON に関してもよしなに処理してくれるのかと思ったんですが、AKS node 上の全てのログの第 3 フィールドが F になっていることから、あくまでログの長さが膨大になったがために複数行に出力された時のためのもので、明示的に改行が含まれるメッセージを出力した場合は関係ないみたいですね。
というわけで、JSON が複数行にまたがるケースでは stage.multiline を使って複数行をひとまとめのログにする必要があります。stage.multiline は firstline として 1 行目のログにマッチする正規表現を指定する必要があります。JSON のログのみしか想定しない場合は ^{$ で大丈夫ですが、JSON 以外のログも想定する場合は ^[^\t}](タブ、} 以外の文字で始まる行)が今回の場合は最も望ましい結果になるでしょう。
loki.process "main" {
  stage.multiline {
    firstline = "^[^\t}]"
  }

  stage.json {
    expressions = {observed_timestamp = "ObservedTimestamp"}
  }

  stage.drop {
    source = "observed_timestamp"
  }

  forward_to = [loki.echo.debug.receiver]
}

loki.echo "debug" {}
JSON のログをパースして変換する
OpenTelemetry の standard output log exporter のログを OTLP receiver に送ったログに似た形式で取り込むことを考えます。
OpenTelemetry Collector の filelog receiver だとこんな感じです。
だいぶ雑な感じですが、loki.process の場合は以下のような設定にすれば良さそうです。
loki.source.file "log_scrape" {
  targets    = local.file_match.local_files.targets
  forward_to = [loki.process.main.receiver]
  tail_from_end = true
}

loki.process "main" {
  stage.json {
    expressions = {
      Timestamp = "",
      ObservedTimestamp = "",
      Severity = "",
      SeverityText = "",
      Body = "Body.Value",
      Attributes = "",
      TraceID = "",
      SpanID = "",
      TraceFlags = "",
      Resource = "",
      DroppedAttributes = "",
    }
  }

  stage.timestamp {
    source = "Timestamp"
    format = "RFC3339"
  }

  stage.output {
    source = "Body"
  }

  stage.structured_metadata {
    values = {
      observed_timestamp = "ObservedTimestamp",
      severity_number = "Severity",
      severity_text = "SeverityText",
      attributes = "Attributes",
      trace_id = "TraceID",
      span_id = "SpanID",
      trace_flags = "TraceFlags",
      resource = "Resource",
      dropped_attributes = "DroppedAttributes",
    }
  }

  forward_to = [loki.echo.debug.receiver]
}

loki.echo "debug" {}
各 stage でやっていることを説明します。例として次のようなログが入力として与えられた場合を考えます。
timestamp: 2025-09-28 22:07:28.190986 +0900 JST
log_line: {"Timestamp":"2025-09-28T09:03:51.787320833Z","ObservedTimestamp":"2025-09-28T09:03:51.787324124Z","Severity":9,"SeverityText":"INFO","Body":{"Type":"String","Value":"Hello World!"},"Attributes":[{"Key":"key1","Value":{"Type":"String","Value":"value1"}}],"TraceID":"4f4758e0dbacc537e87d9f09c5102d59","SpanID":"0b2f8bd6cadae160","TraceFlags":"01","Resource":[{"Key":"service.name","Value":{"Type":"STRING","Value":"hello"}},{"Key":"service.version","Value":{"Type":"STRING","Value":"0.0.1"}},{"Key":"telemetry.sdk.language","Value":{"Type":"STRING","Value":"go"}},{"Key":"telemetry.sdk.name","Value":{"Type":"STRING","Value":"opentelemetry"}},{"Key":"telemetry.sdk.version","Value":{"Type":"STRING","Value":"1.38.0"}}],"Scope":{"Name":"github.com/abicky/opentelemetry-collector-k8s-example","Version":"","SchemaURL":"","Attributes":{}},"DroppedAttributes":0}
labels: {
  "filename": "/tmp/log/a.log"
}
structured_metadata: {}
extracted_data: {}
まず、stage.json によって extracted data にいくつかのフィールドが抽出されます。
timestamp: 2025-09-28 22:07:28.190986 +0900 JST
log_line: {"Timestamp":"2025-09-28T09:03:51.787320833Z","ObservedTimestamp":"2025-09-28T09:03:51.787324124Z","Severity":9,"SeverityText":"INFO","Body":{"Type":"String","Value":"Hello World!"},"Attributes":[{"Key":"key1","Value":{"Type":"String","Value":"value1"}}],"TraceID":"4f4758e0dbacc537e87d9f09c5102d59","SpanID":"0b2f8bd6cadae160","TraceFlags":"01","Resource":[{"Key":"service.name","Value":{"Type":"STRING","Value":"hello"}},{"Key":"service.version","Value":{"Type":"STRING","Value":"0.0.1"}},{"Key":"telemetry.sdk.language","Value":{"Type":"STRING","Value":"go"}},{"Key":"telemetry.sdk.name","Value":{"Type":"STRING","Value":"opentelemetry"}},{"Key":"telemetry.sdk.version","Value":{"Type":"STRING","Value":"1.38.0"}}],"Scope":{"Name":"github.com/abicky/opentelemetry-collector-k8s-example","Version":"","SchemaURL":"","Attributes":{}},"DroppedAttributes":0}
labels: {
  "filename": "/tmp/log/a.log"
}
structured_metadata: {}
extracted_data: {
  "Timestamp": "2025-09-28T09:03:51.787320833Z",
  "ObservedTimestamp": "2025-09-28T09:03:51.787324124Z",
  "Severity": 9,
  "SeverityText": "INFO",
  "Body" = "Body.Value",
  "Attributes": "[{\"Key\":\"key1\",\"Value\":{\"Type\":\"String\",\"Value\":\"value1\"}}]",
  "TraceID": "4f4758e0dbacc537e87d9f09c5102d59",
  "SpanID": "0b2f8bd6cadae160",
  "TraceFlags": "01",
  "Resource": "[{\"Key\":\"service.name\",\"Value\":{\"Type\":\"STRING\",\"Value\":\"hello\"}},{\"Key\":\"service.version\",\"Value\":{\"Value\":\"0.0.1\",\"Type\":\"STRING\"}},{\"Key\":\"telemetry.sdk.language\",\"Value\":{\"Type\":\"STRING\",\"Value\":\"go\"}},{\"Key\":\"telemetry.sdk.name\",\"Value\":{\"Type\":\"STRING\",\"Value\":\"opentelemetry\"}},{\"Key\":\"telemetry.sdk.version\",\"Value\":{\"Type\":\"STRING\",\"Value\":\"1.38.0\"}}]",
  "Scope" = "",
  "DroppedAttributes": 0
}
次に、stage.timestamp と stage.output によって timestamp と log line が書き換えられます。
timestamp: 2025-09-28 09:03:51.787320833 +0000 UTC
log_line: Hello World!
labels: {
  "filename": "/tmp/log/a.log"
}
structured_metadata: {}
extracted_data: {
  "Timestamp": "2025-09-28T09:03:51.787320833Z",
  "ObservedTimestamp": "2025-09-28T09:03:51.787324124Z",
  "Severity": 9,
  "SeverityText": "INFO",
  "Body" = "Body.Value",
  "Attributes": "[{\"Key\":\"key1\",\"Value\":{\"Type\":\"String\",\"Value\":\"value1\"}}]",
  "TraceID": "4f4758e0dbacc537e87d9f09c5102d59",
  "SpanID": "0b2f8bd6cadae160",
  "TraceFlags": "01",
  "Resource": "[{\"Key\":\"service.name\",\"Value\":{\"Type\":\"STRING\",\"Value\":\"hello\"}},{\"Key\":\"service.version\",\"Value\":{\"Value\":\"0.0.1\",\"Type\":\"STRING\"}},{\"Key\":\"telemetry.sdk.language\",\"Value\":{\"Type\":\"STRING\",\"Value\":\"go\"}},{\"Key\":\"telemetry.sdk.name\",\"Value\":{\"Type\":\"STRING\",\"Value\":\"opentelemetry\"}},{\"Key\":\"telemetry.sdk.version\",\"Value\":{\"Type\":\"STRING\",\"Value\":\"1.38.0\"}}]",
  "Scope" = "",
  "DroppedAttributes": 0
}
最後に、stage.structured_metadata によって指定したデータが structured metadata に付与されます。
timestamp: 2025-09-28 09:03:51.787320833 +0000 UTC
log_line: Hello World!
labels: {
  "filename": "/tmp/log/a.log"
}
structured_metadata: {
  "attributes": "[{\"Key\":\"key1\",\"Value\":{\"Type\":\"String\",\"Value\":\"value1\"}}]",
  "dropped_attributes": "0",
  "observed_timestamp": "2025-09-28T09:03:51.787324124Z",
  "resource": "[{\"Key\":\"service.name\",\"Value\":{\"Type\":\"STRING\",\"Value\":\"hello\"}},{\"Key\":\"service.version\",\"Value\":{\"Value\":\"0.0.1\",\"Type\":\"STRING\"}},{\"Key\":\"telemetry.sdk.language\",\"Value\":{\"Type\":\"STRING\",\"Value\":\"go\"}},{\"Key\":\"telemetry.sdk.name\",\"Value\":{\"Type\":\"STRING\",\"Value\":\"opentelemetry\"}},{\"Key\":\"telemetry.sdk.version\",\"Value\":{\"Type\":\"STRING\",\"Value\":\"1.38.0\"}}]",
  "severity_number": "9",
  "severity_text": "INFO",
  "span_id": "0b2f8bd6cadae160",
  "trace_flags": "01",
  "trace_id": "4f4758e0dbacc537e87d9f09c5102d59"
}
extracted_data: {
  "Timestamp": "2025-09-28T09:03:51.787320833Z",
  "ObservedTimestamp": "2025-09-28T09:03:51.787324124Z",
  "Severity": 9,
  "SeverityText": "INFO",
  "Body" = "Body.Value",
  "Attributes": "[{\"Key\":\"key1\",\"Value\":{\"Type\":\"String\",\"Value\":\"value1\"}}]",
  "TraceID": "4f4758e0dbacc537e87d9f09c5102d59",
  "SpanID": "0b2f8bd6cadae160",
  "TraceFlags": "01",
  "Resource": "[{\"Key\":\"service.name\",\"Value\":{\"Type\":\"STRING\",\"Value\":\"hello\"}},{\"Key\":\"service.version\",\"Value\":{\"Value\":\"0.0.1\",\"Type\":\"STRING\"}},{\"Key\":\"telemetry.sdk.language\",\"Value\":{\"Type\":\"STRING\",\"Value\":\"go\"}},{\"Key\":\"telemetry.sdk.name\",\"Value\":{\"Type\":\"STRING\",\"Value\":\"opentelemetry\"}},{\"Key\":\"telemetry.sdk.version\",\"Value\":{\"Type\":\"STRING\",\"Value\":\"1.38.0\"}}]",
  "Scope" = "",
  "DroppedAttributes": 0
}
本来であれば Attributes や Resource の各フィールドは structured metadata にマージできれば良いんですが、stage.structured_metadata では明示的に extracted data のフィールドを指定する必要があるため、事前に Attributes や Resource にどのようなフィールドが含まれるのかわかっていないと難しそうです。
デバッグ方法
最後に loki.process のデバッグ方法を紹介します。
Alloy のデバッグビルド
いつ廃止されるかわかりませんが、実は開発者向けには stages.Debug と stages.Inspect が用意されており、これらを手動で true にしてビルドした上で log level を debug にすれば各 stage の詳細なログを確認できます。
これらの変数を true にしつつ自前で Alloy をビルドするには以下のコマンドを実行します。Linux の場合、sed コマンドの -i と '' の間のスペースは削除する必要があります。
git clone https://github.com/grafana/alloy.git
cd alloy
sed -i '' 's/Debug = false/Debug = true/' internal/component/loki/process/stages/util.go
sed -i '' 's/Inspect = false/Inspect = true/' internal/component/loki/process/stages/util.go
make generate-ui
make alloy
上記のコマンドによって build/alloy が作成されます。make generate-ui を実行しないと、build/alloy が作成されても Web UI (デフォルトで localhost:12345) が Not found になるので注意してください。
なお、grafana/alloy#503 で inspect stage が導入されることが提案され、debug.variables の導入も提案されましたが、後者に関しては棄却されたようです。
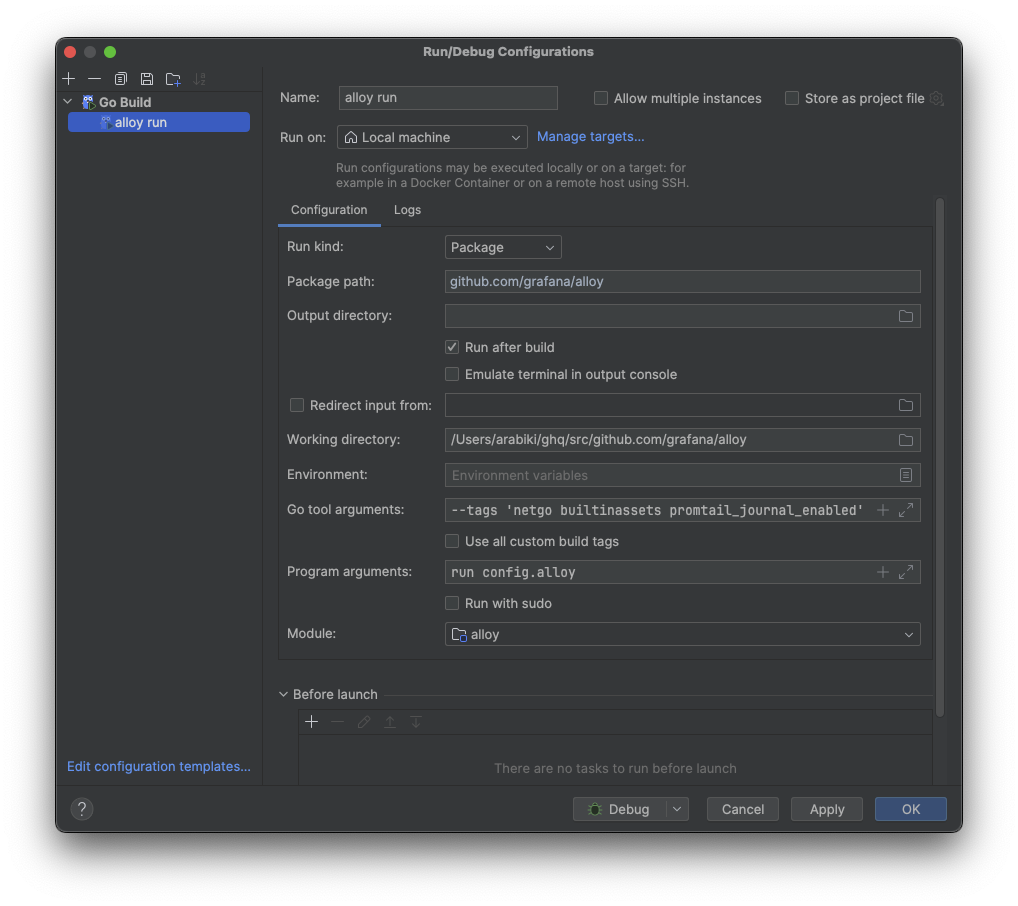
もし IDE と連携したい場合は make alloy で実行されるコマンドを参考に IDE の設定をすると良いです。以下のスクリーンショットは GoLand の例です。
デバッグログの確認
前工程で作成された build/alloy を使ってみます。
今回は config.alloy として次のファイルを利用します。
logging {
  level  = "debug"
}

local.file_match "local_files" {
  path_targets = [{"__path__" = "/tmp/log/*.log"}]
  sync_period = "5s"
}

loki.source.file "log_scrape" {
  targets    = local.file_match.local_files.targets
  forward_to = [loki.process.main.receiver]
  tail_from_end = true
}

loki.process "main" {
  stage.json {
    expressions = {
      Timestamp = "",
      ObservedTimestamp = "",
      Severity = "",
      SeverityText = "",
      Body = "Body.Value",
      Attributes = "",
      TraceID = "",
      SpanID = "",
      TraceFlags = "",
      Resource = "",
      Scope = "",
      DroppedAttributes = "",
    }
  }

  stage.timestamp {
    source = "Timestamp"
    format = "RFC3339"
  }

  stage.output {
    source = "Body"
  }

  stage.structured_metadata {
    values = {
      observed_timestamp = "ObservedTimestamp",
      severity_number = "Severity",
      severity_text = "SeverityText",
      attributes = "Attributes",
      trace_id = "TraceID",
      span_id = "SpanID",
      trace_flags = "TraceFlags",
      resource = "Resource",
      dropped_attributes = "DroppedAttributes",
    }
  }

  forward_to = [loki.echo.debug.receiver]
}

loki.echo "debug" {}
これは「JSON のログをパースして変換する」で利用したものに少しの設定を加えたものです。
それでは起動してみます。
build/alloy run config.alloy
入力データとして /tmp/log/a.log に JSON を書き込みます。
echo '{"Timestamp":"2025-09-28T09:03:51.787320833Z","ObservedTimestamp":"2025-09-28T09:03:51.787324124Z","Severity":9,"SeverityText":"INFO","Body":{"Type":"String","Value":"Hello World!"},"Attributes":[{"Key":"key1","Value":{"Type":"String","Value":"value1"}}],"TraceID":"4f4758e0dbacc537e87d9f09c5102d59","SpanID":"0b2f8bd6cadae160","TraceFlags":"01","Resource":[{"Key":"service.name","Value":{"Type":"STRING","Value":"hello"}},{"Key":"service.version","Value":{"Type":"STRING","Value":"0.0.1"}},{"Key":"telemetry.sdk.language","Value":{"Type":"STRING","Value":"go"}},{"Key":"telemetry.sdk.name","Value":{"Type":"STRING","Value":"opentelemetry"}},{"Key":"telemetry.sdk.version","Value":{"Type":"STRING","Value":"1.38.0"}}],"Scope":{"Name":"github.com/abicky/opentelemetry-collector-k8s-example","Version":"","SchemaURL":"","Attributes":{}},"DroppedAttributes":0}' >> /tmp/log/a.log
すると、Alloy から以下のようなログが出力されます。
ts=2025-09-28T13:07:28.192684Z level=debug msg="extracted data debug in json stage" component_path=/ component_id=loki.process.main component=stage type=json extracted_data="map[Attributes:[{\"Key\":\"key1\",\"Value\":{\"Type\":\"String\",\"Value\":\"value1\"}}] Body:Hello World! DroppedAttributes:0 ObservedTimestamp:2025-09-28T09:03:51.787324124Z Resource:[{\"Key\":\"service.name\",\"Value\":{\"Type\":\"STRING\",\"Value\":\"hello\"}},{\"Key\":\"service.version\",\"Value\":{\"Value\":\"0.0.1\",\"Type\":\"STRING\"}},{\"Key\":\"telemetry.sdk.language\",\"Value\":{\"Type\":\"STRING\",\"Value\":\"go\"}},{\"Key\":\"telemetry.sdk.name\",\"Value\":{\"Type\":\"STRING\",\"Value\":\"opentelemetry\"}},{\"Key\":\"telemetry.sdk.version\",\"Value\":{\"Type\":\"STRING\",\"Value\":\"1.38.0\"}}] Scope:{\"SchemaURL\":\"\",\"Attributes\":{},\"Name\":\"github.com/abicky/opentelemetry-collector-k8s-example\",\"Version\":\"\"} Severity:9 SeverityText:INFO SpanID:0b2f8bd6cadae160 Timestamp:2025-09-28T09:03:51.787320833Z TraceFlags:01 TraceID:4f4758e0dbacc537e87d9f09c5102d59 filename:/tmp/log/a.log]"
[inspect: timestamp stage]:
{stages.Entry}.Entry.Entry.Timestamp:
	-: 2025-09-28 22:07:28.190986 +0900 JST
	+: 2025-09-28 09:03:51.787320833 +0000 UTC
[inspect: output stage]:
{stages.Entry}.Entry.Entry.Line:
	-: {"Timestamp":"2025-09-28T09:03:51.787320833Z","ObservedTimestamp":"2025-09-28T09:03:51.787324124Z","Severity":9,"SeverityText":"INFO","Body":{"Type":"String","Value":"Hello World!"},"Attributes":[{"Key":"key1","Value":{"Type":"String","Value":"value1"}}],"TraceID":"4f4758e0dbacc537e87d9f09c5102d59","SpanID":"0b2f8bd6cadae160","TraceFlags":"01","Resource":[{"Key":"service.name","Value":{"Type":"STRING","Value":"hello"}},{"Key":"service.version","Value":{"Type":"STRING","Value":"0.0.1"}},{"Key":"telemetry.sdk.language","Value":{"Type":"STRING","Value":"go"}},{"Key":"telemetry.sdk.name","Value":{"Type":"STRING","Value":"opentelemetry"}},{"Key":"telemetry.sdk.version","Value":{"Type":"STRING","Value":"1.38.0"}}],"Scope":{"Name":"github.com/abicky/opentelemetry-collector-k8s-example","Version":"","SchemaURL":"","Attributes":{}},"DroppedAttributes":0}
	+: Hello World!
ts=2025-09-28T13:07:28.196264Z level=info component_path=/ component_id=loki.echo.debug receiver=loki.echo.debug entry="Hello World!" entry_timestamp=2025-09-28T09:03:51.787Z labels="{filename=\"/tmp/log/a.log\"}" structured_metadata="{\"attributes\":\"[{\\\"Key\\\":\\\"key1\\\",\\\"Value\\\":{\\\"Type\\\":\\\"String\\\",\\\"Value\\\":\\\"value1\\\"}}]\",\"dropped_attributes\":\"0\",\"observed_timestamp\":\"2025-09-28T09:03:51.787324124Z\",\"resource\":\"[{\\\"Key\\\":\\\"service.name\\\",\\\"Value\\\":{\\\"Type\\\":\\\"STRING\\\",\\\"Value\\\":\\\"hello\\\"}},{\\\"Key\\\":\\\"service.version\\\",\\\"Value\\\":{\\\"Value\\\":\\\"0.0.1\\\",\\\"Type\\\":\\\"STRING\\\"}},{\\\"Key\\\":\\\"telemetry.sdk.language\\\",\\\"Value\\\":{\\\"Type\\\":\\\"STRING\\\",\\\"Value\\\":\\\"go\\\"}},{\\\"Key\\\":\\\"telemetry.sdk.name\\\",\\\"Value\\\":{\\\"Type\\\":\\\"STRING\\\",\\\"Value\\\":\\\"opentelemetry\\\"}},{\\\"Key\\\":\\\"telemetry.sdk.version\\\",\\\"Value\\\":{\\\"Type\\\":\\\"STRING\\\",\\\"Value\\\":\\\"1.38.0\\\"}}]\",\"severity_number\":\"9\",\"severity_text\":\"INFO\",\"span_id\":\"0b2f8bd6cadae160\",\"trace_flags\":\"01\",\"trace_id\":\"4f4758e0dbacc537e87d9f09c5102d59\"}"
stage.json で抽出されたデータ、stage.timestamp による変更内容、stage.output による変更内容が表示されていることがわかるかと思います。stage.json に関するログは level を debug にして stages.Debug を true にしないと表示されず、inspect のログは stages.Inspect を true にしないと表示されません。
Kubernetes 上の Alloy をリモートデバッグする
Kubernetes 上で動いている Alloy をデバッグしようと思うとひと手間かかります。基本的に delve を使うことになるので、container image に同梱するようにします。
例えば Dockerfile や Makefile に以下のような変更を加えると良いでしょう。
diff --git a/Dockerfile b/Dockerfile
index 3051d524c..12bf1f523 100644
--- a/Dockerfile
+++ b/Dockerfile
@@ -36,6 +36,9 @@ RUN --mount=type=cache,target=/root/.cache/go-build \
     GOEXPERIMENT=${GOEXPERIMENT} \
     make alloy

+FROM golang:1.25 AS dlv
+RUN go install github.com/go-delve/delve/cmd/dlv@latest
+
 ###

 FROM public.ecr.aws/ubuntu/ubuntu:noble
@@ -59,6 +62,7 @@ RUN apt-get update \


 COPY --from=build --chown=${UID}:${UID} /src/alloy/build/alloy /bin/alloy
+COPY --from=dlv --chown=${UID}:${UID} /go/bin/dlv /bin/dlv
 COPY --chown=${UID}:${UID} example-config.alloy /etc/alloy/config.alloy

 # Create alloy user in container, but do not set it as default
@@ -71,6 +75,6 @@ RUN groupadd --gid $UID $USERNAME \
     && chown -R $USERNAME:$USERNAME /var/lib/alloy \
     && chmod -R 770 /var/lib/alloy

-ENTRYPOINT ["/bin/alloy"]
+ENTRYPOINT ["dlv", "--listen=:2345", "--headless=true", "--api-version=2", "--accept-multiclient", "exec", "/bin/alloy", "--"]
 ENV ALLOY_DEPLOY_MODE=docker
 CMD ["run", "/etc/alloy/config.alloy", "--storage.path=/var/lib/alloy/data"]
diff --git a/Makefile b/Makefile
index ec2de618b..c17f6bcc6 100644
--- a/Makefile
+++ b/Makefile
@@ -128,7 +128,7 @@ GO_LDFLAGS   := -X $(VPREFIX).Branch=$(GIT_BRANCH)                        \
                 -X $(VPREFIX).BuildDate=$(shell date -u +"%Y-%m-%dT%H:%M:%SZ")

 DEFAULT_FLAGS    := $(GO_FLAGS)
-DEBUG_GO_FLAGS   := -ldflags "$(GO_LDFLAGS)" -tags "$(GO_TAGS)"
+DEBUG_GO_FLAGS   := -ldflags "$(GO_LDFLAGS)" -tags "$(GO_TAGS)" -gcflags "all=-N -l"
 RELEASE_GO_FLAGS := -ldflags "-s -w $(GO_LDFLAGS)" -tags "$(GO_TAGS)"

 ifeq ($(RELEASE_BUILD),1)
diff --git a/internal/component/loki/process/stages/util.go b/internal/component/loki/process/stages/util.go
index 3825186ed..90af7a419 100644
--- a/internal/component/loki/process/stages/util.go
+++ b/internal/component/loki/process/stages/util.go
@@ -15,10 +15,10 @@ var (
 	// so this global is used for that purpose. This allows us to skip allocations of log messages at the
 	// debug level when debug level logging is not enabled. Log level allocations can become very expensive
 	// as we log numerous log entries per log line at debug level.
-	Debug = false
+	Debug = true

 	// Inspect is used to debug promtail pipelines by showing diffs between pipeline stages
-	Inspect = false
+	Inspect = true
 )

 const (
上記の変更を加えた上で container image をビルドします。
make alloy-image
ビルドできたら Kubernetes cluster が pull できる場所に配置します。minikube で手軽に試すなら、public repository に push するか、次のようにビルドされた image を load すると良いでしょう。
minikube image load grafana/alloy
動作確認には Deploy Grafana Alloy on Kubernetes で使われている Alloy Helm chart を使います。Configure Kubernetes Monitoring で紹介されている Kubernetes Monitoring Helm chart の方が洗練されていますが、テスト用途では Alloy Helm chart の方が手軽で良いでしょう。
今回利用する values.yaml は次のとおりです。
values.yaml
image:
  repository: grafana/alloy
  tag: latest
alloy:
  mounts:
    dockercontainers: true
    varlog: true
  extraPorts:
  - name: delve
    port: 2345
    targetPort: 2345
    protocol: TCP
  configMap:
    content: |
      logging {
        level  = "debug"
      }

      // Feature: Pod Logs
      declare "pod_logs" {
        argument "logs_destinations" {
          comment = "Must be a list of log destinations where collected logs should be forwarded to"
        }

        discovery.relabel "filtered_pods" {
          targets = discovery.kubernetes.pods.targets
          rule {
            source_labels = ["__meta_kubernetes_namespace"]
            action = "replace"
            target_label = "namespace"
          }
          rule {
            source_labels = ["__meta_kubernetes_pod_name"]
            action = "replace"
            target_label = "pod"
          }
          rule {
            source_labels = ["__meta_kubernetes_pod_container_name"]
            action = "replace"
            target_label = "container"
          }
          rule {
            source_labels = ["__meta_kubernetes_namespace", "__meta_kubernetes_pod_container_name"]
            separator = "/"
            action = "replace"
            replacement = "$1"
            target_label = "job"
          }

          // set the container runtime as a label
          rule {
            action = "replace"
            source_labels = ["__meta_kubernetes_pod_container_id"]
            regex = "^(\\S+):\\/\\/.+$"
            replacement = "$1"
            target_label = "tmp_container_runtime"
          }

          // make all labels on the pod available to the pipeline as labels,
          // they are omitted before write to loki via stage.label_keep unless explicitly set
          rule {
            action = "labelmap"
            regex = "__meta_kubernetes_pod_label_(.+)"
          }

          // make all annotations on the pod available to the pipeline as labels,
          // they are omitted before write to loki via stage.label_keep unless explicitly set
          rule {
            action = "labelmap"
            regex = "__meta_kubernetes_pod_annotation_(.+)"
          }

          // explicitly set service_name. if not set, loki will automatically try to populate a default.
          // see https://grafana.com/docs/loki/latest/get-started/labels/#default-labels-for-all-users
          //
          // choose the first value found from the following ordered list:
          // - pod.annotation[resource.opentelemetry.io/service.name]
          // - pod.label[app.kubernetes.io/name]
          // - k8s.pod.name
          // - k8s.container.name
          rule {
            action = "replace"
            source_labels = [
              "__meta_kubernetes_pod_annotation_resource_opentelemetry_io_service_name",
              "__meta_kubernetes_pod_label_app_kubernetes_io_name",
              "__meta_kubernetes_pod_container_name",
            ]
            separator = ";"
            regex = "^(?:;*)?([^;]+).*$"
            replacement = "$1"
            target_label = "service_name"
          }

          // explicitly set service_namespace.
          //
          // choose the first value found from the following ordered list:
          // - pod.annotation[resource.opentelemetry.io/service.namespace]
          // - pod.namespace
          rule {
            action = "replace"
            source_labels = [
              "__meta_kubernetes_pod_annotation_resource_opentelemetry_io_service_namespace",
              "namespace",
            ]
            separator = ";"
            regex = "^(?:;*)?([^;]+).*$"
            replacement = "$1"
            target_label = "service_namespace"
          }

          // explicitly set service_instance_id.
          //
          // choose the first value found from the following ordered list:
          // - pod.annotation[resource.opentelemetry.io/service.instance.id]
          // - concat([k8s.namespace.name, k8s.pod.name, k8s.container.name], '.')
          rule {
            source_labels = ["__meta_kubernetes_pod_annotation_resource_opentelemetry_io_service_instance_id"]
            target_label = "service_instance_id"
          }
          rule {
            source_labels = ["service_instance_id", "namespace", "pod", "container"]
            separator = "."
            regex = "^\\.([^.]+\\.[^.]+\\.[^.]+)$"
            target_label = "service_instance_id"
          }

          // set resource attributes
          rule {
            action = "labelmap"
            regex = "__meta_kubernetes_pod_annotation_resource_opentelemetry_io_(.+)"
          }
          rule {
            source_labels = ["__meta_kubernetes_pod_annotation_k8s_grafana_com_logs_job"]
            regex = "(.+)"
            target_label = "job"
          }
          rule {
            source_labels = ["__meta_kubernetes_pod_label_app_kubernetes_io_name"]
            regex = "(.+)"
            target_label = "app_kubernetes_io_name"
          }
        }

        discovery.kubernetes "pods" {
          role = "pod"
          selectors {
            role = "pod"
            field = "spec.nodeName=" + sys.env("HOSTNAME")
            label = "run"
          }
        }

        discovery.relabel "filtered_pods_with_paths" {
          targets = discovery.relabel.filtered_pods.output

          rule {
            source_labels = ["__meta_kubernetes_pod_uid", "__meta_kubernetes_pod_container_name"]
            separator = "/"
            action = "replace"
            replacement = "/var/log/pods/*$1/*.log"
            target_label = "__path__"
          }
        }

        local.file_match "pod_logs" {
          path_targets = discovery.relabel.filtered_pods_with_paths.output
        }

        loki.source.file "pod_logs" {
          targets    = local.file_match.pod_logs.targets
          forward_to = [loki.process.pod_logs.receiver]
        }

        loki.process "pod_logs" {
          stage.match {
            selector = "{tmp_container_runtime=~\"containerd|cri-o\"}"
            // the cri processing stage extracts the following k/v pairs: log, stream, time, flags
            stage.cri {}

            // Set the extract flags and stream values as labels
            stage.labels {
              values = {
                flags  = "",
                stream  = "",
              }
            }
          }

          stage.match {
            selector = "{tmp_container_runtime=\"docker\"}"
            // the docker processing stage extracts the following k/v pairs: log, stream, time
            stage.docker {}

            // Set the extract stream value as a label
            stage.labels {
              values = {
                stream  = "",
              }
            }
          }

          // Drop the filename label, since it's not really useful in the context of Kubernetes, where we already have cluster,
          // namespace, pod, and container labels. Drop any structured metadata. Also drop the temporary
          // container runtime label as it is no longer needed.
          stage.label_drop {
            values = [
              "filename",
              "tmp_container_runtime",
            ]
          }
          stage.structured_metadata {
            values = {
              "k8s_pod_name" = "k8s_pod_name",
              "pod" = "pod",
              "service_instance_id" = "service_instance_id",
            }
          }

          // Only keep the labels that are defined in the `keepLabels` list.
          stage.label_keep {
            values = ["__tenant_id__","app_kubernetes_io_name","container","instance","job","level","namespace","service_name","service_namespace","deployment_environment","deployment_environment_name","k8s_namespace_name","k8s_deployment_name","k8s_statefulset_name","k8s_daemonset_name","k8s_cronjob_name","k8s_job_name","k8s_node_name"]
          }

          forward_to = argument.logs_destinations.value
        }
      }
      pod_logs "feature" {
        logs_destinations = [
          loki.echo.debug.receiver,
        ]
      }

      loki.echo "debug" {}
config.alloy の内容は Kubernetes Monitoring Helm chart で Pod のログ収集用に生成される内容に次の変更を加えたものです。
--- config.alloy.orig   2025-09-29 22:49:10
+++ config.alloy        2025-09-29 22:50:13
@@ -1,3 +1,7 @@
+logging {
+  level  = "debug"
+}
+
 // Feature: Pod Logs
 declare "pod_logs" {
   argument "logs_destinations" {
@@ -128,6 +132,7 @@
     selectors {
       role = "pod"
       field = "spec.nodeName=" + sys.env("HOSTNAME")
+      label = "run"
     }
   }

@@ -207,39 +212,8 @@
 }
 pod_logs "feature" {
   logs_destinations = [
-    loki.write.grafana_cloud_logs.receiver,
+    loki.echo.debug.receiver,
   ]
 }

-
-
-
-// Destination: grafana-cloud-logs (loki)
-otelcol.exporter.loki "grafana_cloud_logs" {
-  forward_to = [loki.write.grafana_cloud_logs.receiver]
-}
-
-loki.write "grafana_cloud_logs" {
-  endpoint {
-    url = "https://logs-prod-030.grafana.net/loki/api/v1/push"
-    basic_auth {
-      username = convert.nonsensitive(remote.kubernetes.secret.grafana_cloud_logs.data["username"])
-      password = remote.kubernetes.secret.grafana_cloud_logs.data["password"]
-    }
-    tls_config {
-      insecure_skip_verify = false
-    }
-    min_backoff_period = "500ms"
-    max_backoff_period = "5m"
-    max_backoff_retries = "10"
-  }
-  external_labels = {
-    "cluster" = "my-cluster",
-    "k8s_cluster_name" = "my-cluster",
-  }
-}
-
-remote.kubernetes.secret "grafana_cloud_logs" {
-  name      = "grafana-cloud-logs-grafana-k8s-monitoring"
-  namespace = "monitoring"
-}
+loki.echo "debug" {}
要は以下のような変更を加えています。
- log level を debug に設定
-
discovery.kubernetes.podsにlabelを追加してkubectl runで起動した Pod のみを対象に限定- 他の Pod も対象にするとおぞましい量のログが流れるため
- 出力先を
loki.echoに変更
それでは Alloy をインストールします。
helm upgrade --install grafana-alloy grafana/alloy \
    --namespace alloy --create-namespace -f values.yaml
次に、ローカルホストから Alloy の 2345 番ポートにアクセスできるようにします。
kubectl port-forward -n alloy ds/grafana-alloy 2345:2345
最後に、GoLand なり VS Code なりから接続すれば設定したブレークポントで処理を止めることができます。
動作確認してみます。
kubectl run hello-$(date '+%s') --restart=Never -i --image=alpine \
  --annotations="resource.opentelemetry.io/service.name=hello" \
  --annotations="resource.opentelemetry.io/service.version=0.0.1" \
  -- echo 'Hello World!'
上記のコマンドを実行することで、Alloy のログには次のような内容が出力されます。
ts=2025-09-29T23:33:11.565280472Z level=debug msg="extracted data debug in json stage" component_path=/pod_logs.feature component_id=loki.process.pod_logs component=stage type=json extracted_data="map[container:hello-1759188771 filename:/var/log/pods/default_hello-1759188771_6f088a07-7c1d-45b2-b21a-f590ff22ba2d/hello-1759188771/0.log job:default/hello-1759188771 namespace:default output:Hello World!\n pod:hello-1759188771 resource_opentelemetry_io_service_name:hello resource_opentelemetry_io_service_version:0.0.1 run:hello-1759188771 service_instance_id:default.hello-1759188771.hello-1759188771 service_name:hello service_namespace:default service_version:0.0.1 stream:stdout timestamp:2025-09-29T23:32:56.37882809Z tmp_container_runtime:docker]"
[inspect: labels stage]:
{stages.Entry}.Entry.Labels:
        -: {container="hello-1759188771", filename="/var/log/pods/default_hello-1759188771_6f088a07-7c1d-45b2-b21a-f590ff22ba2d/hello-1759188771/0.log", job="default/hello-1759188771", namespace="default", pod="hello-1759188771", resource_opentelemetry_io_service_name="hello", resource_opentelemetry_io_service_version="0.0.1", run="hello-1759188771", service_instance_id="default.hello-1759188771.hello-1759188771", service_name="hello", service_namespace="default", service_version="0.0.1", tmp_container_runtime="docker"}
        +: {container="hello-1759188771", filename="/var/log/pods/default_hello-1759188771_6f088a07-7c1d-45b2-b21a-f590ff22ba2d/hello-1759188771/0.log", job="default/hello-1759188771", namespace="default", pod="hello-1759188771", resource_opentelemetry_io_service_name="hello", resource_opentelemetry_io_service_version="0.0.1", run="hello-1759188771", service_instance_id="default.hello-1759188771.hello-1759188771", service_name="hello", service_namespace="default", service_version="0.0.1", stream="stdout", tmp_container_runtime="docker"}
[inspect: timestamp stage]:
{stages.Entry}.Entry.Entry.Timestamp:
        -: 2025-09-29 23:33:11.564708638 +0000 UTC
        +: 2025-09-29 23:32:56.37882809 +0000 UTC
[inspect: output stage]:
{stages.Entry}.Entry.Entry.Line:
        -: {"log":"Hello World!\n","stream":"stdout","time":"2025-09-29T23:32:56.37882809Z"}
        +: Hello World!

[inspect: labels stage]: none
[inspect: labeldrop stage]:
{stages.Entry}.Entry.Labels:
        -: {container="hello-1759188771", filename="/var/log/pods/default_hello-1759188771_6f088a07-7c1d-45b2-b21a-f590ff22ba2d/hello-1759188771/0.log", job="default/hello-1759188771", namespace="default", pod="hello-1759188771", resource_opentelemetry_io_service_name="hello", resource_opentelemetry_io_service_version="0.0.1", run="hello-1759188771", service_instance_id="default.hello-1759188771.hello-1759188771", service_name="hello", service_namespace="default", service_version="0.0.1", stream="stdout", tmp_container_runtime="docker"}
        +: {container="hello-1759188771", job="default/hello-1759188771", namespace="default", pod="hello-1759188771", resource_opentelemetry_io_service_name="hello", resource_opentelemetry_io_service_version="0.0.1", run="hello-1759188771", service_instance_id="default.hello-1759188771.hello-1759188771", service_name="hello", service_namespace="default", service_version="0.0.1", stream="stdout"}
[inspect: labelallow stage]:
{stages.Entry}.Entry.Labels:
        -: {container="hello-1759188771", job="default/hello-1759188771", namespace="default", resource_opentelemetry_io_service_name="hello", resource_opentelemetry_io_service_version="0.0.1", run="hello-1759188771", service_name="hello", service_namespace="default", service_version="0.0.1", stream="stdout"}
        +: {container="hello-1759188771", job="default/hello-1759188771", namespace="default", service_name="hello", service_namespace="default"}
ts=2025-09-29T23:33:11.56969018Z level=info component_path=/ component_id=loki.echo.debug receiver=loki.echo.debug entry="Hello World!\n" entry_timestamp=2025-09-29T23:32:56.378Z labels="{container=\"hello-1759188771\", job=\"default/hello-1759188771\", namespace=\"default\", service_name=\"hello\", service_namespace=\"default\"}" structured_metadata="{\"pod\":\"hello-1759188771\",\"service_instance_id\":\"default.hello-1759188771.hello-1759188771\"}"
なお、上記のコマンドに --rm を付けてしまうと、ログが収集されることなく Pod が削除されてしまうので注意してください。