一定間隔の滞在ユーザ数を高速に求める Presto SQL

例えばアクセスログに各ページにアクセスした時刻と離脱した時刻が入っているとします。次のようなイメージです。
user_id,page,start_at,end_at
236,A,2018-12-01 19:57:19,2018-12-01 20:00:37
494,A,2018-12-01 19:58:04,2018-12-01 19:59:06
上記のようなデータに対して、各ページの滞在ユーザ数を分単位で出したいとします。次のようなアウトプットのイメージです。
page,time,uu
A,2018-12-01 19:57:00,1
A,2018-12-01 19:58:00,2
A,2018-12-01 19:59:00,2
A,2018-12-01 20:00:00,1
Presto でどのような SQL を書いたらこれを高速に求められるかというお話です。
データは S3 に置くことにするので、試したい方は Athena や Amazon Elastic MapReduce (EMR) を使うとサクッと確認できます。
サンプルデータ
次のような Ruby スクリプトで S3 にデータをアップロードします。例えば、環境変数 S3_LOCATION に s3://example.com/test を指定すると、s3://example.com/test/access_logs 以下と s3://example.com/test/time_ranges 以下にデータがアップロードされます。
require 'date'
require 'uri'

require 'aws-sdk-s3'

BASE_DATE = Date.parse('2018-12-01')
DATE_COUNT = 7
PAGES = %w[A B C D]
USER_COUNT = 1000
RECORD_COUNT_PER_DATE = 100_000

s3 = Aws::S3::Client.new
location = URI(ENV['S3_LOCATION'])
bucket = location.host
prefix = location.path[1..-1]

DATE_COUNT.times do |i|
  date = BASE_DATE + i
  Tempfile.open('log') do |f|
    RECORD_COUNT_PER_DATE.times do
      user_id = rand(USER_COUNT) + 1
      page = PAGES.sample
      start_at = date.to_time + rand(86400)
      end_at = start_at + rand(3600)
      f.puts [user_id, page, start_at.strftime('%F %T'), end_at.strftime('%F %T')].join(',')
    end
    f.rewind

    key = File.join(prefix, "access_logs/dt=#{date.strftime('%Y%m%d')}/logs.csv")
    puts "Upload to s3://#{bucket}/#{key}"
    s3.put_object(bucket: bucket, key: key, body: f)
  end

  Tempfile.open('time_ranges') do |f|
    time = date.to_time
    (24 * 60).times do |i|
      f.puts [(time + i * 60).strftime('%F %T'), (time + (i + 1) * 60).strftime('%F %T')].join(',')
    end
    f.rewind

    key = File.join(prefix, "time_ranges/dt=#{date.strftime('%Y%m%d')}/time_ranges.csv")
    puts "Upload to s3://#{bucket}/#{key}"
    s3.put_object(bucket: bucket, key: key, body: f)
  end
end
データをアップロードしたら Hive テーブルを作成します。<YOUR BUCKET>, <PREFIX> は環境変数 S3_LOCATION に応じて変えてください。
CREATE DATABASE IF NOT EXISTS test;

CREATE EXTERNAL TABLE IF NOT EXISTS test.access_logs (
  `user_id` int,
  `page` string,
  `start_at` timestamp,
  `end_at` timestamp
) PARTITIONED BY (
  dt string
)
ROW FORMAT SERDE 'org.apache.hadoop.hive.serde2.lazy.LazySimpleSerDe'
WITH SERDEPROPERTIES (
  'serialization.format' = ',',
  'field.delim' = ','
) LOCATION 's3://<YOUR BUCKET>/<PREFIX>/access_logs/'
TBLPROPERTIES ('has_encrypted_data'='false');

CREATE EXTERNAL TABLE IF NOT EXISTS test.time_ranges (
  `start_at` timestamp,
  `end_at` timestamp
) PARTITIONED BY (
  dt string
)
ROW FORMAT SERDE 'org.apache.hadoop.hive.serde2.lazy.LazySimpleSerDe'
WITH SERDEPROPERTIES (
  'serialization.format' = ',',
  'field.delim' = ','
) LOCATION 's3://<YOUR BUCKET>/<PREFIX>/time_ranges/'
TBLPROPERTIES ('has_encrypted_data'='false');

MSCK REPAIR TABLE test.access_logs;
MSCK REPAIR TABLE test.time_ranges;
以上で準備完了です。
遅い SQL
おそらく多くの人は先ほどサンプルデータとして作成した time_ranges テーブルのようなものを導入し、ログデータと JOIN することで算出するんじゃないかと思います。
select
  page
  , time_ranges.start_at as time
  , count(distinct user_id) as uu
from
  hive.test.access_logs
  inner join
    hive.test.time_ranges
  on
    access_logs.start_at < time_ranges.end_at
    and access_logs.end_at >= time_ranges.start_at
where
  access_logs.dt in ('20181201', '20181202', '20181203', '20181204', '20181205', '20181206', '20181207')
  and time_ranges.dt in ('20181201', '20181202', '20181203', '20181204', '20181205', '20181206', '20181207')
group by
  1, 2
order by
  1, 2
;
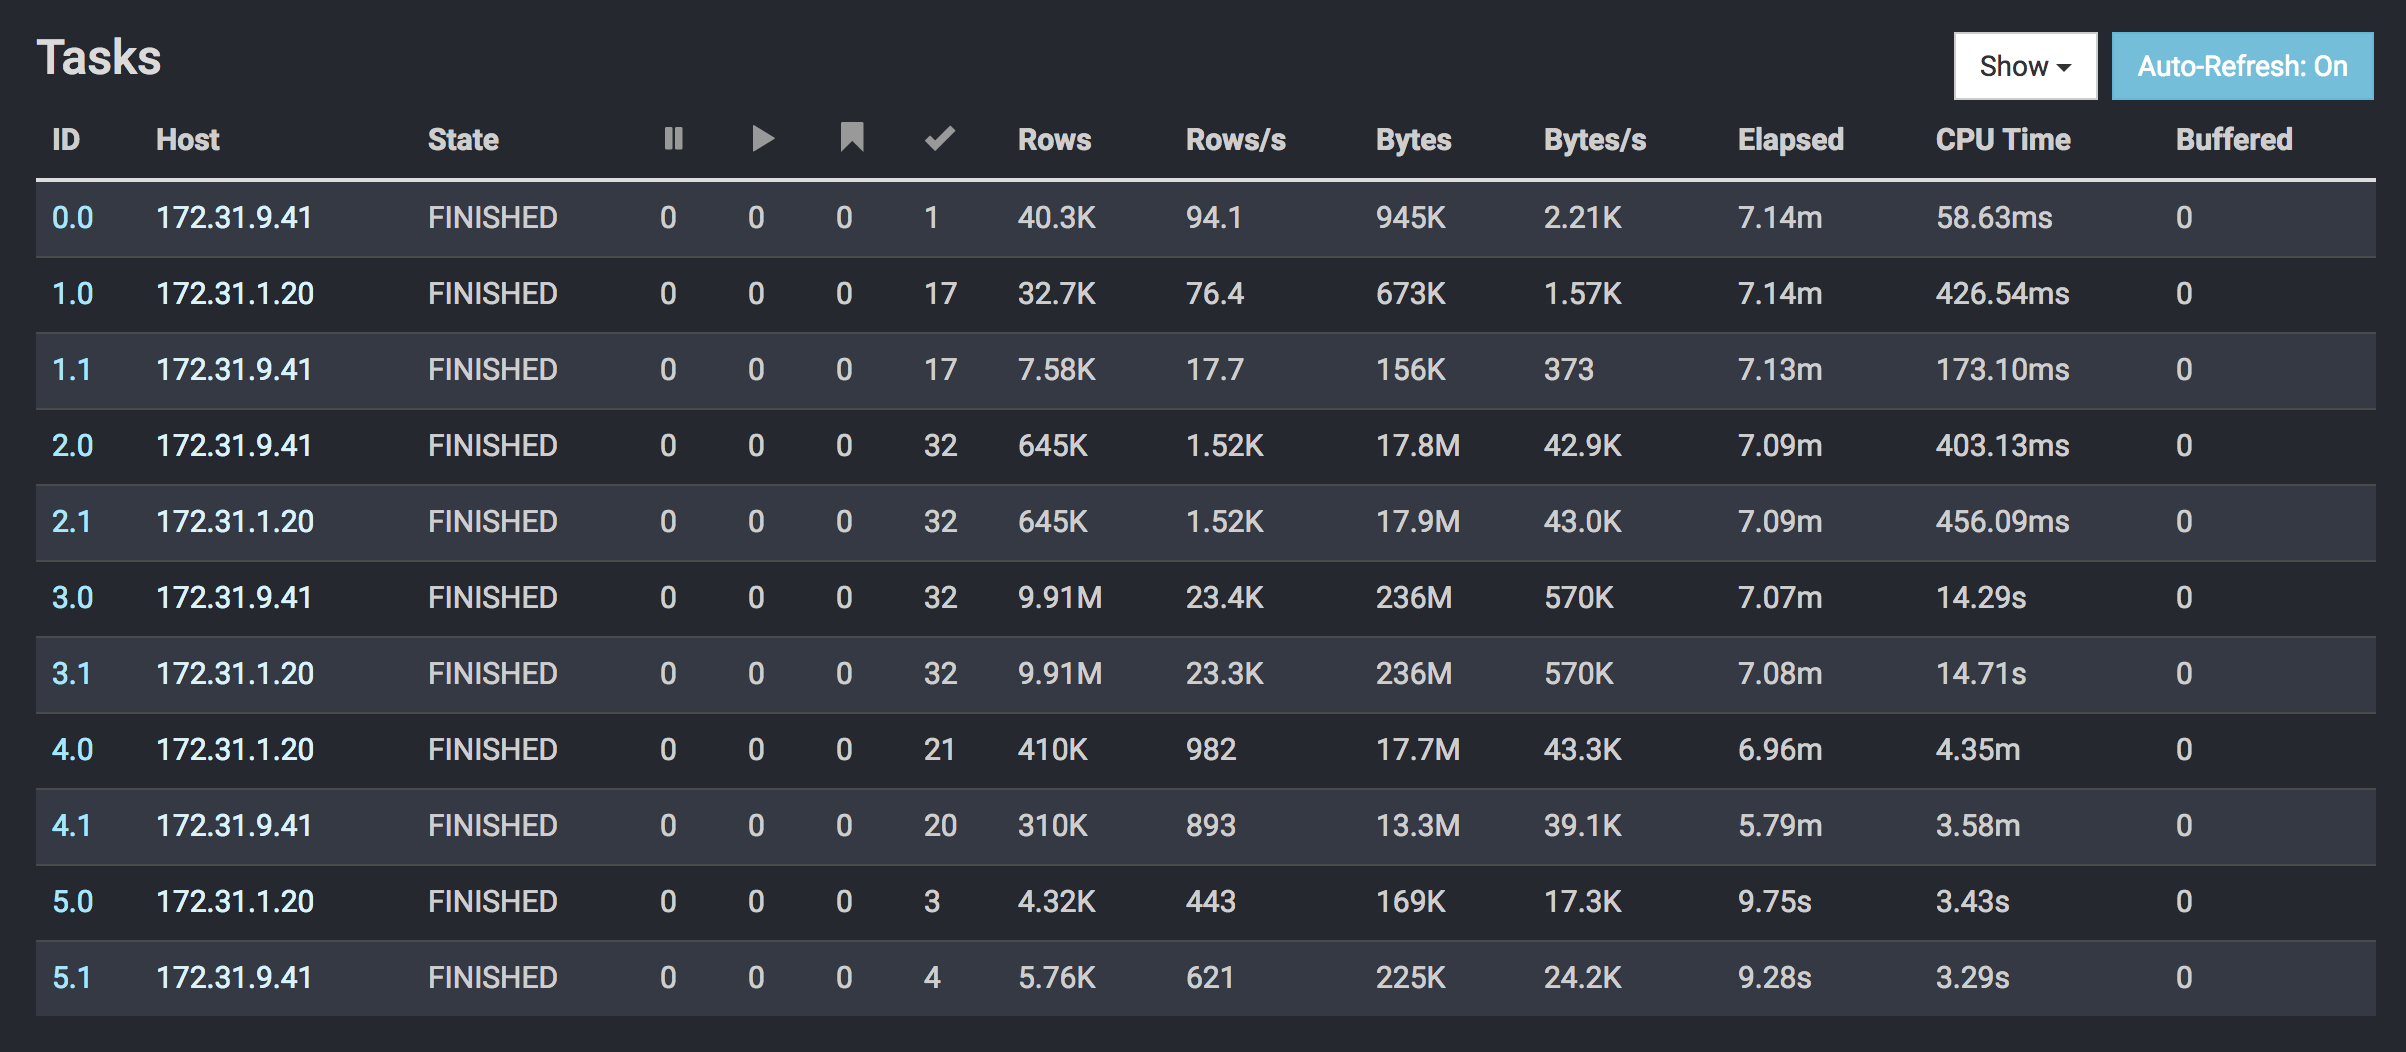
これを実行してみると各タスクにかかった時間等は次のようになります。クエリ全体で CPU time は 8.55m です。
速い SQL
次のように SEQUENCE 関数と UNNEST を組み合わせることで劇的に速くなります。
select
  page
  , time
  , count(distinct user_id) as uu
from
  hive.test.access_logs
  cross join unnest(
    sequence(date_trunc('minute', start_at), end_at, interval '1' minute)
  ) as t (time)
where
  dt in ('20181201', '20181202', '20181203', '20181204', '20181205', '20181206', '20181207')
  and time < timestamp '2018-12-08'
group by
  1, 2
order by
  1, 2
;
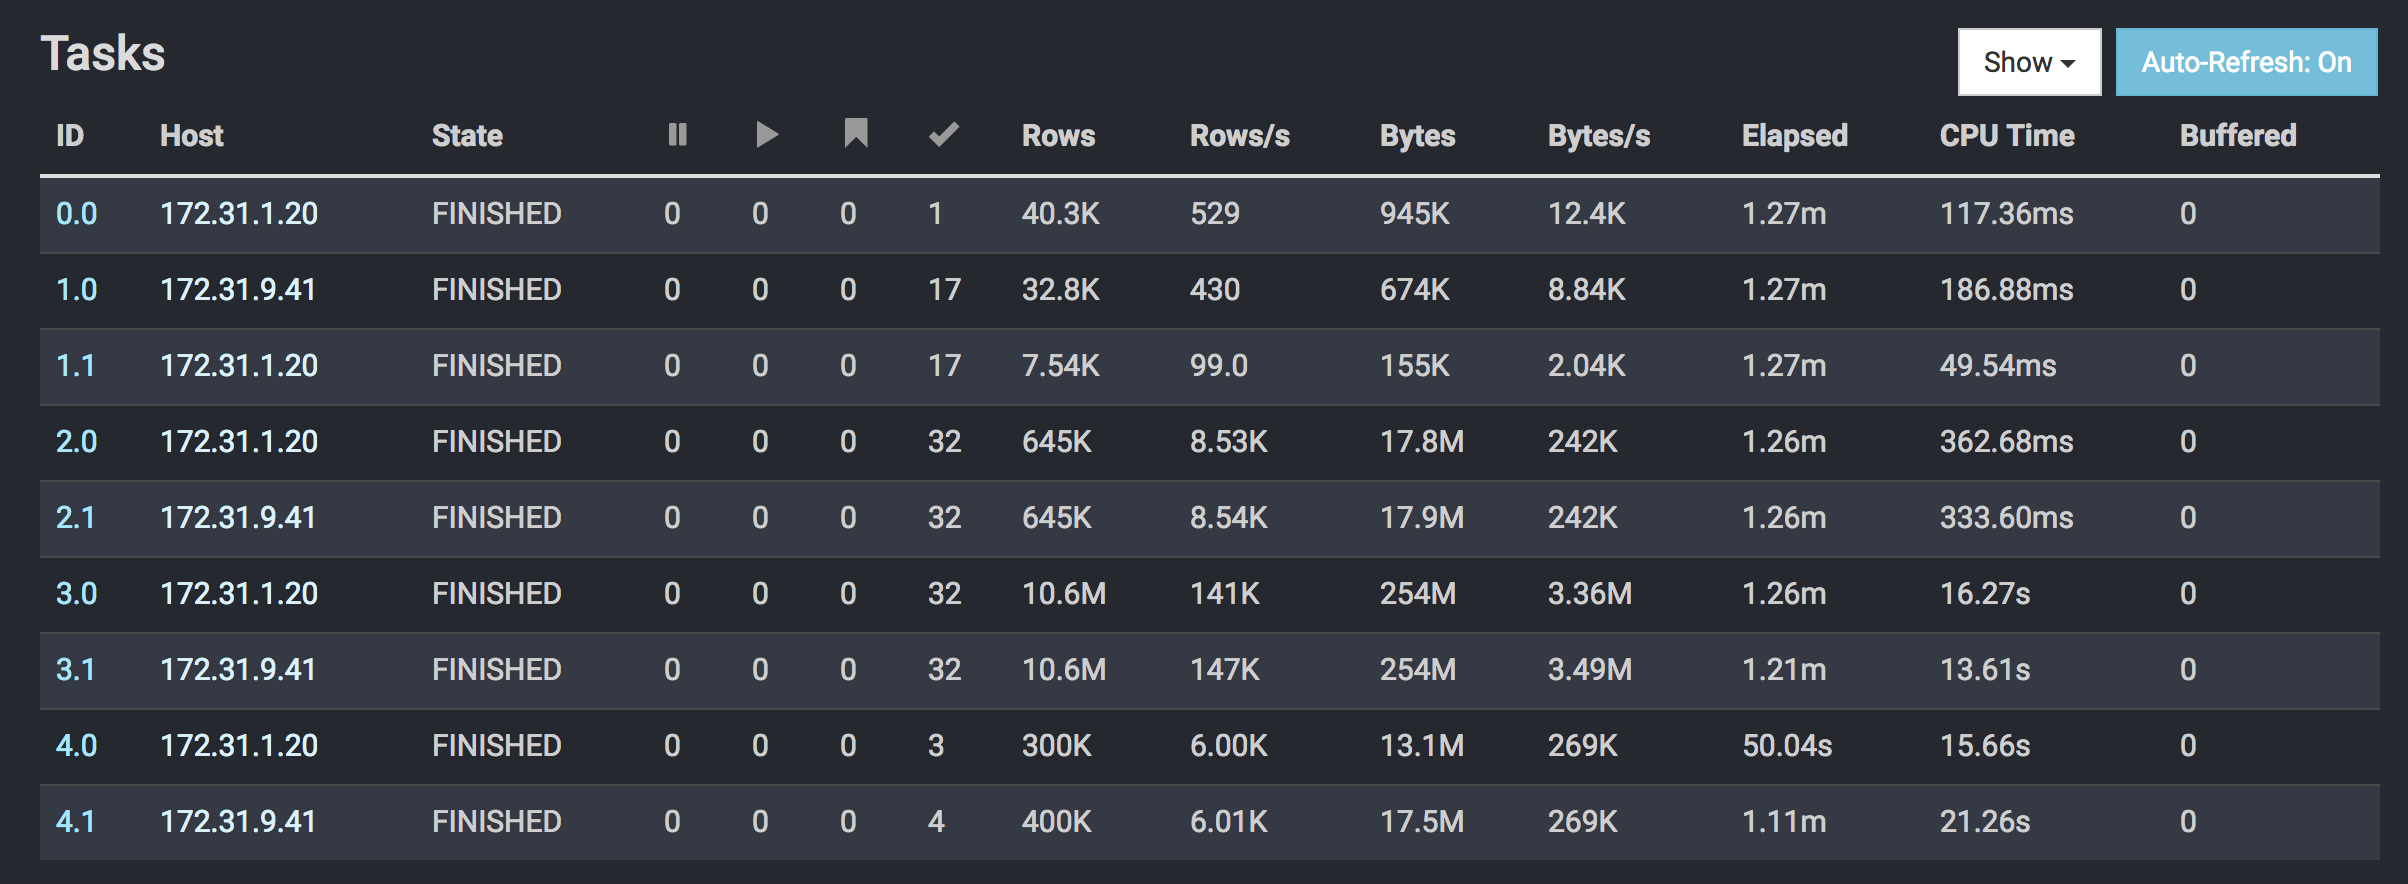
これを実行してみると各タスクにかかった時間等は次のようになります。クエリ全体で CPU time は 1.13m です。
何故速いのか?
速い SQL の方は time_ranges テーブルとの CROSS JOIN がないからです。どちらの SQL も stage 1, 2, 3 は大差ないので、それ以外の箇所について EXPLAIN の結果を見てみます。
速い SQL は次のようになっています。
- Aggregate(PARTIAL)[page, field, user_id][$hashvalue_18] => [page:varchar, field:timestamp, user_id:integer, $hashvalue_18:bigint]
    - FilterProject[filterPredicate = ("field" < "$literal$timestamp"(1544227200000))] => [user_id:integer, page:varchar, field:timestamp, $hashvalue_18:bigint]
            $hashvalue_18 := "combine_hash"("combine_hash"("combine_hash"(bigint '0', COALESCE("$operator$hash_code"("page"), 0)), COALESCE("$operator$hash_code"("field"), 0)), COALESCE("$operator$hash_code"("user_id"), 0))
        - Unnest [replicate=user_id:integer, page:varchar, unnest=sequence:array(timestamp)] => [user_id:integer, page:varchar, field:timestamp]
            - ScanProject[table = hive:test:access_logs] => [user_id:integer, page:varchar, sequence:array(timestamp)]
                    Cost: {rows: ? (?), cpu: ?, memory: 0.00, network: 0.00}/{rows: ? (?), cpu: ?, memory: 0.00, network: 0.00}
                    sequence := "sequence"("date_trunc"('minute', "start_at"), "end_at", "$literal$interval day to second"(BIGINT '60000'))
                    LAYOUT: test.access_logs
                    end_at := end_at:timestamp:3:REGULAR
                    user_id := user_id:int:0:REGULAR
                    page := page:string:1:REGULAR
                    start_at := start_at:timestamp:2:REGULAR
                    dt:string:-1:PARTITION_KEY
                        :: [[20181201], [20181202], [20181203], [20181204], [20181205], [20181206], [20181207]]
一方、遅い SQL は次のようになっています。
- Aggregate(PARTIAL)[page, start_at_0, user_id][$hashvalue_27] => [page:varchar, start_at_0:timestamp, user_id:integer, $hashvalue_27:bigint]
    - FilterProject[filterPredicate = (("start_at" < "end_at_1") AND ("end_at" >= "start_at_0"))] => [user_id:integer, page:varchar, start_at_0:timestamp, $hashvalue_27:bigint]
            $hashvalue_27 := "combine_hash"("combine_hash"("combine_hash"(bigint '0', COALESCE("$operator$hash_code"("page"), 0)), COALESCE("$operator$hash_code"("start_at_0"), 0)), COALESCE("$operator$hash_code"("user_id"), 0))
        - CrossJoin => [user_id:integer, page:varchar, start_at:timestamp, end_at:timestamp, start_at_0:timestamp, end_at_1:timestamp]
                Distribution: REPLICATED
            - TableScan[hive:test:access_logs] => [user_id:integer, page:varchar, start_at:timestamp, end_at:timestamp]
                    Cost: {rows: ? (?), cpu: ?, memory: 0.00, network: 0.00}
                    LAYOUT: test.access_logs
                    end_at := end_at:timestamp:3:REGULAR
                    user_id := user_id:int:0:REGULAR
                    page := page:string:1:REGULAR
                    start_at := start_at:timestamp:2:REGULAR
                    dt:string:-1:PARTITION_KEY
                        :: [[20181201], [20181202], [20181203], [20181204], [20181205], [20181206], [20181207]]
            - LocalExchange[SINGLE] () => start_at_0:timestamp, end_at_1:timestamp
                    Cost: {rows: ? (?), cpu: ?, memory: 0.00, network: ?}
                - RemoteExchange[REPLICATE] => start_at_0:timestamp, end_at_1:timestamp
                        Cost: {rows: ? (?), cpu: ?, memory: 0.00, network: ?}
                    - TableScan[hive:test:time_ranges] => [start_at_0:timestamp, end_at_1:timestamp]
                            Cost: {rows: ? (?), cpu: ?, memory: 0.00, network: 0.00}
                            LAYOUT: test.time_ranges
                            start_at_0 := start_at:timestamp:0:REGULAR
                            end_at_1 := end_at:timestamp:1:REGULAR
                            dt:string:-1:PARTITION_KEY
                                :: [[20181201], [20181202], [20181203], [20181204], [20181205], [20181206], [20181207]]
遅い SQL の方は CrossJoin という文字列があることから、CROSS JOIN が行われていることがわかると思います。
CROSS JOIN によってどれぐらいデータが膨れ上がっているかは、次のようにして確認することができます。
[hadoop@ip-172-31-0-160 ~]$ curl -s http://localhost:8889/v1/query/20181209_202140_00000_9r8m6?pretty | \
> jq '.outputStage.subStages[0].subStages[0].subStages[0].subStages[0].stageStats.operatorSummaries'
[
  {
    "stageId": 4,
    "pipelineId": 0,
    "operatorId": 0,
    "planNodeId": "375",
    "operatorType": "ExchangeOperator",
    "totalDrivers": 32,
    "addInputCalls": 14,
    "addInputWall": "0.00ns",
    "addInputCpu": "0.00ns",
    "inputDataSize": "315.58kB",
    "inputPositions": 20160,
    "sumSquaredInputPositions": 78796800,
    "getOutputCalls": 14,
    "getOutputWall": "192.88ms",
    "getOutputCpu": "0.00ns",
    "outputDataSize": "354.38kB",
    "outputPositions": 20160,
    "physicalWrittenDataSize": "0B",
    "blockedWall": "11.11m",
    "finishCalls": 0,
    "finishWall": "0.00ns",
    "finishCpu": "0.00ns",
    "userMemoryReservation": "0B",
    "revocableMemoryReservation": "0B",
    "systemMemoryReservation": "0B",
    "peakUserMemoryReservation": "0B",
    "peakSystemMemoryReservation": "0B",
    "peakTotalMemoryReservation": "0B",
    "info": {
      "@type": "exchangeClientStatus",
      "bufferedBytes": 0,
      "maxBufferedBytes": 116010,
      "averageBytesPerRequest": 8271,
      "successfulRequestsCount": 624,
      "bufferedPages": 0,
      "noMoreLocations": true,
      "pageBufferClientStatuses": []
    }
  },
  {
    "stageId": 4,
    "pipelineId": 1,
    "operatorId": 0,
    "planNodeId": "459",
    "operatorType": "LocalExchangeSourceOperator",
    "totalDrivers": 2,
    "addInputCalls": 14,
    "addInputWall": "0.00ns",
    "addInputCpu": "0.00ns",
    "inputDataSize": "354.38kB",
    "inputPositions": 20160,
    "sumSquaredInputPositions": 203212800,
    "getOutputCalls": 14,
    "getOutputWall": "39.65ms",
    "getOutputCpu": "0.00ns",
    "outputDataSize": "354.38kB",
    "outputPositions": 20160,
    "physicalWrittenDataSize": "0B",
    "blockedWall": "42.57s",
    "finishCalls": 0,
    "finishWall": "0.00ns",
    "finishCpu": "0.00ns",
    "userMemoryReservation": "0B",
    "revocableMemoryReservation": "0B",
    "systemMemoryReservation": "0B",
    "peakUserMemoryReservation": "0B",
    "peakSystemMemoryReservation": "0B",
    "peakTotalMemoryReservation": "0B"
  },
  {
    "stageId": 4,
    "pipelineId": 0,
    "operatorId": 1,
    "planNodeId": "459",
    "operatorType": "LocalExchangeSinkOperator",
    "totalDrivers": 32,
    "addInputCalls": 14,
    "addInputWall": "47.44ms",
    "addInputCpu": "0.00ns",
    "inputDataSize": "354.38kB",
    "inputPositions": 20160,
    "sumSquaredInputPositions": 78796800,
    "getOutputCalls": 0,
    "getOutputWall": "0.00ns",
    "getOutputCpu": "0.00ns",
    "outputDataSize": "354.38kB",
    "outputPositions": 20160,
    "physicalWrittenDataSize": "0B",
    "blockedWall": "0.00ns",
    "finishCalls": 32,
    "finishWall": "123.93ms",
    "finishCpu": "0.00ns",
    "userMemoryReservation": "0B",
    "revocableMemoryReservation": "0B",
    "systemMemoryReservation": "0B",
    "peakUserMemoryReservation": "0B",
    "peakSystemMemoryReservation": "0B",
    "peakTotalMemoryReservation": "0B"
  },
  {
    "stageId": 4,
    "pipelineId": 2,
    "operatorId": 0,
    "planNodeId": "0",
    "operatorType": "TableScanOperator",
    "totalDrivers": 7,
    "addInputCalls": 21,
    "addInputWall": "0.00ns",
    "addInputCpu": "0.00ns",
    "inputDataSize": "30.64MB",
    "inputPositions": 700000,
    "sumSquaredInputPositions": 70000000000,
    "getOutputCalls": 175,
    "getOutputWall": "36.07s",
    "getOutputCpu": "0.00ns",
    "outputDataSize": "19.36MB",
    "outputPositions": 700000,
    "physicalWrittenDataSize": "0B",
    "blockedWall": "0.00ns",
    "finishCalls": 0,
    "finishWall": "0.00ns",
    "finishCpu": "0.00ns",
    "userMemoryReservation": "0B",
    "revocableMemoryReservation": "0B",
    "systemMemoryReservation": "0B",
    "peakUserMemoryReservation": "0B",
    "peakSystemMemoryReservation": "928kB",
    "peakTotalMemoryReservation": "928kB"
  },
  {
    "stageId": 4,
    "pipelineId": 1,
    "operatorId": 1,
    "planNodeId": "78",
    "operatorType": "NestedLoopBuildOperator",
    "totalDrivers": 2,
    "addInputCalls": 14,
    "addInputWall": "10.93ms",
    "addInputCpu": "0.00ns",
    "inputDataSize": "354.38kB",
    "inputPositions": 20160,
    "sumSquaredInputPositions": 203212800,
    "getOutputCalls": 0,
    "getOutputWall": "0.00ns",
    "getOutputCpu": "0.00ns",
    "outputDataSize": "354.38kB",
    "outputPositions": 20160,
    "physicalWrittenDataSize": "0B",
    "blockedWall": "11.99m",
    "finishCalls": 6,
    "finishWall": "12.69ms",
    "finishCpu": "0.00ns",
    "userMemoryReservation": "0B",
    "revocableMemoryReservation": "0B",
    "systemMemoryReservation": "0B",
    "peakUserMemoryReservation": "0B",
    "peakSystemMemoryReservation": "0B",
    "peakTotalMemoryReservation": "0B"
  },
  {
    "stageId": 4,
    "pipelineId": 2,
    "operatorId": 1,
    "planNodeId": "78",
    "operatorType": "NestedLoopJoinOperator",
    "totalDrivers": 7,
    "addInputCalls": 21,
    "addInputWall": "4.79ms",
    "addInputCpu": "0.00ns",
    "inputDataSize": "19.36MB",
    "inputPositions": 700000,
    "sumSquaredInputPositions": 70000000000,
    "getOutputCalls": 211855,
    "getOutputWall": "5.60s",
    "getOutputCpu": "0.00ns",
    "outputDataSize": "190.57GB",
    "outputPositions": 7056000000,
    "physicalWrittenDataSize": "0B",
    "blockedWall": "41.81s",
    "finishCalls": 70801,
    "finishWall": "834.11ms",
    "finishCpu": "0.00ns",
    "userMemoryReservation": "0B",
    "revocableMemoryReservation": "0B",
    "systemMemoryReservation": "0B",
    "peakUserMemoryReservation": "0B",
    "peakSystemMemoryReservation": "0B",
    "peakTotalMemoryReservation": "0B"
  },
  {
    "stageId": 4,
    "pipelineId": 2,
    "operatorId": 2,
    "planNodeId": "285",
    "operatorType": "FilterAndProjectOperator",
    "totalDrivers": 7,
    "addInputCalls": 211680,
    "addInputWall": "20.04m",
    "addInputCpu": "0.00ns",
    "inputDataSize": "190.57GB",
    "inputPositions": 7056000000,
    "sumSquaredInputPositions": 7112448000000000000,
    "getOutputCalls": 213823,
    "getOutputWall": "24.11s",
    "getOutputCpu": "0.00ns",
    "outputDataSize": "413.94MB",
    "outputPositions": 21648324,
    "physicalWrittenDataSize": "0B",
    "blockedWall": "0.00ns",
    "finishCalls": 7,
    "finishWall": "14.61ms",
    "finishCpu": "0.00ns",
    "userMemoryReservation": "0B",
    "revocableMemoryReservation": "0B",
    "systemMemoryReservation": "0B",
    "peakUserMemoryReservation": "0B",
    "peakSystemMemoryReservation": "1.32MB",
    "peakTotalMemoryReservation": "1.32MB"
  },
  {
    "stageId": 4,
    "pipelineId": 2,
    "operatorId": 3,
    "planNodeId": "504",
    "operatorType": "HashAggregationOperator",
    "totalDrivers": 7,
    "addInputCalls": 30451,
    "addInputWall": "42.75s",
    "addInputCpu": "0.00ns",
    "inputDataSize": "413.94MB",
    "inputPositions": 21648324,
    "sumSquaredInputPositions": 66951333551584,
    "getOutputCalls": 214441,
    "getOutputWall": "17.41s",
    "getOutputCpu": "0.00ns",
    "outputDataSize": "548.06MB",
    "outputPositions": 19816803,
    "physicalWrittenDataSize": "0B",
    "blockedWall": "2.67s",
    "finishCalls": 41,
    "finishWall": "9.04ms",
    "finishCpu": "0.00ns",
    "userMemoryReservation": "0B",
    "revocableMemoryReservation": "0B",
    "systemMemoryReservation": "0B",
    "peakUserMemoryReservation": "0B",
    "peakSystemMemoryReservation": "16.98MB",
    "peakTotalMemoryReservation": "16.98MB"
  },
  {
    "stageId": 4,
    "pipelineId": 2,
    "operatorId": 4,
    "planNodeId": "504",
    "operatorType": "PartitionedOutputOperator",
    "totalDrivers": 7,
    "addInputCalls": 608,
    "addInputWall": "27.77s",
    "addInputCpu": "0.00ns",
    "inputDataSize": "548.06MB",
    "inputPositions": 19816803,
    "sumSquaredInputPositions": 56102182536067,
    "getOutputCalls": 0,
    "getOutputWall": "0.00ns",
    "getOutputCpu": "0.00ns",
    "outputDataSize": "548.06MB",
    "outputPositions": 19816803,
    "physicalWrittenDataSize": "0B",
    "blockedWall": "0.00ns",
    "finishCalls": 7,
    "finishWall": "93.58ms",
    "finishCpu": "0.00ns",
    "userMemoryReservation": "0B",
    "revocableMemoryReservation": "0B",
    "systemMemoryReservation": "0B",
    "peakUserMemoryReservation": "0B",
    "peakSystemMemoryReservation": "1.50MB",
    "peakTotalMemoryReservation": "1.50MB",
    "info": {
      "@type": "partitionedOutput",
      "rowsAdded": 19816803,
      "pagesAdded": 459,
      "outputBufferPeakMemoryUsage": 2852211
    }
  }
]
NestedLoopJoinOperator によって、inputDataSize 19.36MB から outputDataSize 190.57GB になっています。
一方、速い SQL は UNNEST でレコード数が増えたところで inputDataSize 196.85MB から outputDataSize 413.71MB の増加で済んでいます。
[hadoop@ip-172-31-0-160 ~]$ curl -s http://localhost:8889/v1/query/20181209_202944_00001_9r8m6?pretty | \
> jq '.outputStage.subStages[0].subStages[0].subStages[0].subStages[0].stageStats.operatorSummaries'
[
  {
    "stageId": 4,
    "pipelineId": 0,
    "operatorId": 0,
    "planNodeId": "1",
    "operatorType": "ScanFilterAndProjectOperator",
    "totalDrivers": 7,
    "addInputCalls": 228,
    "addInputWall": "0.00ns",
    "addInputCpu": "0.00ns",
    "inputDataSize": "30.64MB",
    "inputPositions": 700000,
    "sumSquaredInputPositions": 70000000000,
    "getOutputCalls": 228,
    "getOutputWall": "26.19s",
    "getOutputCpu": "0.00ns",
    "outputDataSize": "196.85MB",
    "outputPositions": 700000,
    "physicalWrittenDataSize": "0B",
    "blockedWall": "0.00ns",
    "finishCalls": 0,
    "finishWall": "0.00ns",
    "finishCpu": "0.00ns",
    "userMemoryReservation": "0B",
    "revocableMemoryReservation": "0B",
    "systemMemoryReservation": "0B",
    "peakUserMemoryReservation": "0B",
    "peakSystemMemoryReservation": "1.25MB",
    "peakTotalMemoryReservation": "1.25MB"
  },
  {
    "stageId": 4,
    "pipelineId": 0,
    "operatorId": 1,
    "planNodeId": "2",
    "operatorType": "UnnestOperator",
    "totalDrivers": 7,
    "addInputCalls": 203,
    "addInputWall": "24.57ms",
    "addInputCpu": "0.00ns",
    "inputDataSize": "196.85MB",
    "inputPositions": 700000,
    "sumSquaredInputPositions": 70000000000,
    "getOutputCalls": 641,
    "getOutputWall": "14.51s",
    "getOutputCpu": "0.00ns",
    "outputDataSize": "413.71MB",
    "outputPositions": 21690448,
    "physicalWrittenDataSize": "0B",
    "blockedWall": "0.00ns",
    "finishCalls": 63,
    "finishWall": "20.58ms",
    "finishCpu": "0.00ns",
    "userMemoryReservation": "0B",
    "revocableMemoryReservation": "0B",
    "systemMemoryReservation": "0B",
    "peakUserMemoryReservation": "0B",
    "peakSystemMemoryReservation": "0B",
    "peakTotalMemoryReservation": "0B"
  },
  {
    "stageId": 4,
    "pipelineId": 0,
    "operatorId": 2,
    "planNodeId": "410",
    "operatorType": "FilterAndProjectOperator",
    "totalDrivers": 7,
    "addInputCalls": 420,
    "addInputWall": "1.75s",
    "addInputCpu": "0.00ns",
    "inputDataSize": "413.71MB",
    "inputPositions": 21690448,
    "sumSquaredInputPositions": 67210840559784,
    "getOutputCalls": 3123,
    "getOutputWall": "6.82s",
    "getOutputCpu": "0.00ns",
    "outputDataSize": "598.72MB",
    "outputPositions": 21648324,
    "physicalWrittenDataSize": "0B",
    "blockedWall": "0.00ns",
    "finishCalls": 9,
    "finishWall": "388.54us",
    "finishCpu": "0.00ns",
    "userMemoryReservation": "0B",
    "revocableMemoryReservation": "0B",
    "systemMemoryReservation": "0B",
    "peakUserMemoryReservation": "0B",
    "peakSystemMemoryReservation": "1.06MB",
    "peakTotalMemoryReservation": "1.06MB"
  },
  {
    "stageId": 4,
    "pipelineId": 0,
    "operatorId": 3,
    "planNodeId": "384",
    "operatorType": "HashAggregationOperator",
    "totalDrivers": 7,
    "addInputCalls": 2899,
    "addInputWall": "42.55s",
    "addInputCpu": "0.00ns",
    "inputDataSize": "598.72MB",
    "inputPositions": 21648324,
    "sumSquaredInputPositions": 66951333551584,
    "getOutputCalls": 3767,
    "getOutputWall": "15.76s",
    "getOutputCpu": "0.00ns",
    "outputDataSize": "588.46MB",
    "outputPositions": 21277683,
    "physicalWrittenDataSize": "0B",
    "blockedWall": "13.18s",
    "finishCalls": 38,
    "finishWall": "1.74ms",
    "finishCpu": "0.00ns",
    "userMemoryReservation": "0B",
    "revocableMemoryReservation": "0B",
    "systemMemoryReservation": "0B",
    "peakUserMemoryReservation": "0B",
    "peakSystemMemoryReservation": "18.11MB",
    "peakTotalMemoryReservation": "18.11MB"
  },
  {
    "stageId": 4,
    "pipelineId": 0,
    "operatorId": 4,
    "planNodeId": "384",
    "operatorType": "PartitionedOutputOperator",
    "totalDrivers": 7,
    "addInputCalls": 641,
    "addInputWall": "31.62s",
    "addInputCpu": "0.00ns",
    "inputDataSize": "588.46MB",
    "inputPositions": 21277683,
    "sumSquaredInputPositions": 64678616978785,
    "getOutputCalls": 0,
    "getOutputWall": "0.00ns",
    "getOutputCpu": "0.00ns",
    "outputDataSize": "588.46MB",
    "outputPositions": 21277683,
    "physicalWrittenDataSize": "0B",
    "blockedWall": "0.00ns",
    "finishCalls": 7,
    "finishWall": "67.08ms",
    "finishCpu": "0.00ns",
    "userMemoryReservation": "0B",
    "revocableMemoryReservation": "0B",
    "systemMemoryReservation": "0B",
    "peakUserMemoryReservation": "0B",
    "peakSystemMemoryReservation": "1.63MB",
    "peakTotalMemoryReservation": "1.63MB",
    "info": {
      "@type": "partitionedOutput",
      "rowsAdded": 21277683,
      "pagesAdded": 484,
      "outputBufferPeakMemoryUsage": 5817696
    }
  }
]
以上、ちょっとした工夫で Presto SQL が速くなる例でした。