Grafana と Loki でアプリケーションエラーを意味のある単位で監視する

SLI/SLO やエラーバジェットに則ってサービスをモニタリングする場合、個別のアプリケーションエラーのモニタリングの重要度は高くないかもしれません。一方で、アプリケーションエラーの先には困っているユーザがいるわけだし、SLI/SLO で全ての事象をカバーできるわけではないので、個別のアプリケーションエラーを全く監視しないというのもまずいでしょう。
アプリケーションエラーの管理には Sentry や Rollbar を利用するのが便利ですが、Grafana に様々な telemetry が集約されているサービスでアプリケーションエラーだけ別のサービスを利用するのも何なので、Grafana と Loki でアプリケーションエラーを監視するにはどのようにすれば運用しやすそうか考え、デモを作ってみました。
どんな感じになったか?
以下のように Slack にエラーメッセージや stacktrace 情報などを表示するようにしています。
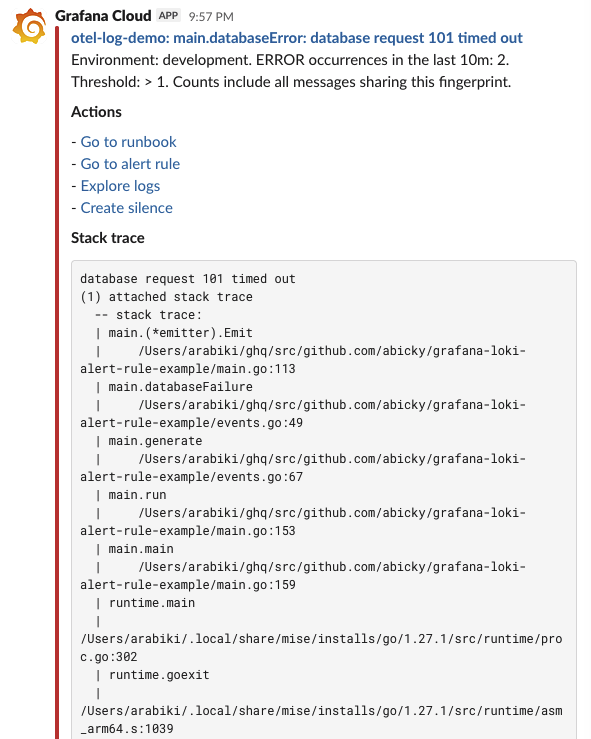
利用したアプリケーションや設定は https://github.com/abicky/grafana-loki-alert-rule-example に置いてあります。
以降、どのような流れでこの通知を実現していったか解説します。
要件
自分の場合、Rollbar が使い慣れているのですが、Rollbar には次のような機能がありました。
- エラーのグループ化
- Default Grouping Algorithm にあるように、stacktrace などを考慮してよしなに同じエラーをグループ化してくれる
- item が 1 つのグループで、occurrence がグループに属する個別のエラー
- エラーの level や発生回数などによる通知の出し分け
- 例えば初見のエラーと再発のエラーで通知ルールを変えたり、短時間に warning が大量に出たら通知するなどができる
- アプリケーションエラーの内容を Slack や PagerDuty などへ通知
例えば Slack の通知は次のような感じです。
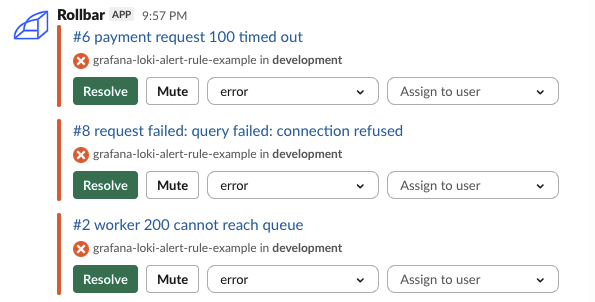
他にも様々な機能がありますが、Grafana で実現することを考えると上記の内容をある程度満たせるようにしたいと考えました。
また、Slack に通知するものとして、次のような機能も求められると考えました。
- runbook が用意されている場合は Slack のメッセージに runbook へのリンクが含まれている
- エラーが発生した時刻付近のログを確認するための Explorer へのリンクが含まれている
- stacktrace が Slack 上で確認できる
- 別の alert rule で網羅されているエラーを通知しないようにできる
方針
汎用的な仕組みを構築しようと思うと非常に複雑な alert rule を設定することになるので、次のような制約と方針を取りました。
- 対象は Go アプリケーションで、github.com/cockroachdb/errors の
Formattableで stacktrace をログの structured metadata として記録する- stacktrace からエラーメッセージを除外したものをベースにグループ化する(Rollbar と似たような方針)
- 配列で記録することも考えられるが、配列で保持してもあまりメリットはなさそうだし、exception.stacktrace が string なのでそれに従う
- 発生回数に対する閾値は severity のみによって変更可能で、発生回数の時間幅は 10 分固定
- Grafana Cloud はクエリのスキャン量が書き込みの 100 倍を超えるとコストがかかるので、スキャン量を抑えたい (Fair use query ratio)
severity_textを indexed label にする- 前述のとおり、スキャン量を減らしたい
- FATAL なら 1 回以上、ERROR なら 2 回以上、WARN なら 11 回以上で Slack へ通知
- 閾値や時間幅はサービスの特性によって変わるのでテキトーな値
- エラーのグループ化ロジックは Grafana alert rule 側に持つ
- とりあえず試してみる分には既存アプリケーションに手を入れなくて良いので手軽かと
実装
やりたいことは比較的シンプルなのに対して、実装しなければならないものはそこそこ多く、以下のような対応が必要です。
- FATAL レベルの対応
- エラーのグループごとに発生回数をカウントする LogQL
- グループ化したエラーの代表的なエラーメッセージや stacktrace を抽出する LogQL
- severity ごとの閾値を定義する LogQL
- alert rule の annotation
- 通知に使う message template
それぞれ解説していきます。
FATAL レベルの対応
OpenTelemetry では Displaying Severity のとおり、FATAL というログレベルが定義されているんですが、Go で otelslog package を利用する場合、CRITICAL や FATAL のようなログレベルは提供されていません。よって、次のようにログレベルを定義する必要があります。
// The slog bridge maps level 12 to OTLP severity 21; Alloy labels it FATAL.
const levelCritical = slog.LevelError + (slog.LevelError - slog.LevelWarn)
これだけだと severity_text は ERROR+4 になってしまうため、 次のように Grafana Alloy で変換する必要があります。
otelcol.processor.transform "severity" {
  log_statements {
    context = "log"
    statements = [
      // Normalize custom slog texts such as ERROR+4 to the OTLP FATAL range.
      `set(severity_text, "FATAL") where severity_number >= 21 and severity_number <= 24`,
      // Loki's OTLP attribute mapping indexes attributes, not LogRecord fields.
      `set(attributes["severity_text"], severity_text)`,
    ]
  }
  output {
    logs = [otelcol.processor.batch.logs.input]
  }
}
エラーの発生回数をカウントする LogQL
エラーの発生回数をカウントする LogQL は次のようなクエリです。
sum by (deployment_environment_name, error_group, exception_type, severity) (
  count_over_time(
    {service_name="otel-log-demo", severity_text=~"ERROR|FATAL|WARN"}
    # Exclude errors handled by dedicated metric- or log-based rules from this general rule.
    | alert_general_rule_exclude!="true"
    # errors.Formattable's first two lines and Wraps messages can contain variable error text,
    # such as IP addresses and timestamps.
    # Remove them only from the fingerprint, preserving frame order and line numbers.
    | label_format error_group=`{{ if and .exception_type .exception_stacktrace }}{{ regexReplaceAll "(?m)^Wraps: [^\\r\\n]*(\\r?\\n|$)" (regexReplaceAll "^[^\\r\\n]*\\r?\\n[^\\r\\n]*(\\r?\\n|$)" .exception_stacktrace "") "" }}{{ end }}`
    # Without a usable typed stack, fingerprint the body without hex values or digits.
    | label_format error_group=`{{ if .error_group }}{{ .error_group }}{{ else }}{{ regexReplaceAll "[0-9]+" (regexReplaceAll "0[xX][0-9a-fA-F]+" (__line__) "") "" }}{{ end }}`
    # Use the normalized severity in both alert identity and notification grouping.
    | label_format severity=`{{ .severity_text }}`
    [10m]
  )
)
以下、この LogQL について解説します。
severity_text によるフィルタリング
まず最初に、ログのスキャン量を減らすために log stream の段階で severity_text でフィルタリングしています。
{service_name="otel-log-demo", severity_text=~"ERROR|FATAL|WARN"}
Loki を自前で運用している場合は次のような設定をすることで OTLP endpoint に送られてきたログの severity_text を index label として登録できるようです。
limits_config:
  otlp_config:
    log_attributes:
      - action: index_label
        attributes: [severity_text]
Grafana Cloud の場合、OTLP label mappings にあるように、Loki の設定変更が必要です。厳密には設定変更申請で、UI 上から変更しても反映されるまでに数営業日かかるらしいです。また、無料版だとこの機能が利用できないらしく、UI すら存在しません。
除外対象のログのフィルタリング
次に、alert_general_rule_exclude=true がセットされているログは除外しています。これは「別の alert rule で網羅されているエラーを通知しないようにできる」という要件のためで、アプリケーション側でセットする想定です。
# Exclude errors handled by dedicated metric- or log-based rules from this general rule.
| alert_general_rule_exclude!="true"
グループ化
全く同じエラーメッセージや type でもサービス影響は異なることが予想されるため、Rollbar 同様 stacktrace を利用してグループ化しています。以下がそのための処理です。
# errors.Formattable's first two lines and Wraps messages can contain variable error text,
# such as IP addresses and timestamps.
# Remove them only from the fingerprint, preserving frame order and line numbers.
| label_format error_group=`{{ if and .exception_type .exception_stacktrace }}{{ regexReplaceAll "(?m)^Wraps: [^\\r\\n]*(\\r?\\n|$)" (regexReplaceAll "^[^\\r\\n]*\\r?\\n[^\\r\\n]*(\\r?\\n|$)" .exception_stacktrace "") "" }}{{ end }}`
Go では標準でサポートされている stacktrace(のフォーマット)が存在しないので、前述のとおり、github.com/cockroachdb/errors の Formattable を利用します。どのような stacktrace になるか見てみないと正規表現の内容もピンとこないと思うので、以下のサンプルコードで示します。
package main

import (
	"fmt"
	"net"
	"os"
	"time"

	"github.com/cockroachdb/errors"
)

func connect() error {
	conn, err := net.DialTimeout("tcp", "127.0.0.1:1", time.Second)
	if err != nil {
		return errors.Wrap(err, "failed to connect to 127.0.0.1:1")
	}
	defer conn.Close()
	return nil
}

func run() error {
	if err := connect(); err != nil {
		return fmt.Errorf("failed to connect to database: %w", err)
	}
	return nil
}

func main() {
	if err := run(); err != nil {
		fmt.Printf("%+v\n", errors.Formattable(err))
		os.Exit(1)
	}
}
上記のコードを実行すると、以下のような stacktrace が表示されます。
$ go run -trimpath ./stacktraceexample
failed to connect to database: failed to connect to 127.0.0.1:1: dial tcp 127.0.0.1:1: connect: connection refused
(1) failed to connect to database
Wraps: (2) attached stack trace
  -- stack trace:
  | main.connect
  |     github.com/abicky/grafana-loki-alert-rule-example/stacktraceexample/main.go:15
  | main.run
  |     github.com/abicky/grafana-loki-alert-rule-example/stacktraceexample/main.go:22
  | main.main
  |     github.com/abicky/grafana-loki-alert-rule-example/stacktraceexample/main.go:29
  | runtime.main
  |     runtime/proc.go:302
  | runtime.goexit
  |     runtime/asm_arm64.s:1039
Wraps: (3) failed to connect to 127.0.0.1:1
Wraps: (4) dial tcp 127.0.0.1:1
Wraps: (5) connect
Wraps: (6) connection refused
Error types: (1) *fmt.wrapError (2) *withstack.withStack (3) *errutil.withPrefix (4) *net.OpError (5) *os.SyscallError (6) syscall.Errno
exit status 1
上記のとおり、Formattable の出力結果の最初の 2 行は具体的なエラーメッセージで、”Wraps: “ で始まる行も wrap されているエラーのメッセージが表示されていることがわかります。これらのメッセージには IP アドレスやタイムスタンプなど、エラーの発生ごとに変わる可能性の高い情報が含まれるので除外してグループ化しています。
Rollbar は stacktrace 情報から行番号を除外してグループ化しますが、Rollbar は少しコードが変わっても初見のエラーと再発したエラーを区別したりするためにそのようなロジックが必要なわけで、Grafana の alert rule でそこまで管理する必要はないと思われるので行番号などは削除していません。
最後に、stacktrace(exception_stacktrace)がないケースはエラーメッセージから 16 進数と数字を除外したものをグループ化に利用しています。
# Use the normalized severity in both alert identity and notification grouping.
| label_format severity=`{{ .severity_text }}`
グループ化したエラーの代表的なエラーメッセージや stacktrace を抽出する LogQL
エラーの発生回数をカウントする LogQL の最終結果にはエラーメッセージが含まれていないので、具体的なエラーメッセージを通知に含めるには一工夫必要です。
以下の LogQL は、エラーの発生回数をカウントする LogQL と同じロジックでエラーをグループ化した上で、グループ内で最後に発生したエラーログを抽出しています。
topk by (deployment_environment_name, error_group, exception_type, severity) (
  1,
  max by (deployment_environment_name, error_group, exception_type, severity, error_message, exception_stacktrace, runbook_url, error_time_from, error_time_to) (
    max_over_time(
      {service_name="otel-log-demo", severity_text=~"ERROR|FATAL|WARN"}
      # Exclude errors handled by dedicated metric- or log-based rules from this general rule.
      | alert_general_rule_exclude!="true"
      # errors.Formattable's first two lines and Wraps messages can contain variable error text,
      # such as IP addresses and timestamps.
      # Remove them only from the fingerprint, preserving frame order and line numbers.
      | label_format error_group=`{{ if and .exception_type .exception_stacktrace }}{{ regexReplaceAll "(?m)^Wraps: [^\\r\\n]*(\\r?\\n|$)" (regexReplaceAll "^[^\\r\\n]*\\r?\\n[^\\r\\n]*(\\r?\\n|$)" .exception_stacktrace "") "" }}{{ end }}`
      # Without a usable typed stack, fingerprint the body without hex values or digits.
      | label_format error_group=`{{ if .error_group }}{{ .error_group }}{{ else }}{{ regexReplaceAll "[0-9]+" (regexReplaceAll "0[xX][0-9a-fA-F]+" (__line__) "") "" }}{{ end }}`
      # Use the normalized severity in both alert identity and notification grouping.
      | label_format severity=`{{ .severity_text }}`
      # Include the message for notification display, but not in the labels that identify an alert.
      | label_format error_message=`{{ __line__ }}{{ if and .exception_message (not (contains .exception_message (__line__))) }}: {{ .exception_message }}{{ end }}`
      # Save the Explore time range and expose the timestamp as a numeric value for latest-log selection.
      | label_format error_time_from=`{{ unixEpochMillis ((__timestamp__).Add -10000000000) }}`
      | label_format error_time_to=`{{ unixEpochMillis (__timestamp__) }}`
      | label_format error_epoch=`{{ unixEpochMillis (__timestamp__) }}`
      | unwrap error_epoch
      [10m]
    )
  )
)
初見だと理解が難しいと思うので、具体例として、error_group 付与後の状態が以下の状態になっている場合を考えます。
| Time | error_group | __line__ |
|---|---|---|
| 12:00:01 | database | database request 100 timed out |
| 12:00:05 | database | database request 101 timed out |
| 12:00:03 | payment | payment request 200 failed |
上記のログをメトリクスに変換しているのが次の箇所です。
max_over_time(
  -- snip --
  | unwrap error_epoch
  [10m]
)
これによって、次のように error_epoch が value で残りは label のメトリクスに変換されます。値はテキトーです。
{error_group="database", error_message="database request 100 timed out", ...} 1000
{error_group="database", error_message="database request 101 timed out", ...} 5000
{error_group="payment",  error_message="payment request 200 failed", ...}    3000
あとは PromQL と要領は同じで、max by することで不要な label を落とし、topk でグループごとに最も時刻 (error_epoch) の大きなログを抽出しています。
LogQL のメトリクスクエリの詳細は Unwrapped range aggregations を参照してください。
なお、上記のクエリはエラーが発生していなくても実行されることに注意が必要です。Grafana Cloud では Alert enrichment という仕組みがあり、これを利用することで特定の LogQL にマッチするログを __enrich_logs_lines annotation として付与することができるんですが、どうも alert enrichment の LogQL では {service_name="{{ $labels.service_name }}"} のように alert rule の label を参照することができないようなので、所望のエラーメッセージの取得にはこの仕組みを利用することはできそうにありませんでした。
severity ごとの閾値を定義する LogQL
以下の LogQL を定義することで、severity label を持った定数のメトリクスを生成することができます。
label_replace(vector(1), "severity", "ERROR", "", ".*")
or
label_replace(vector(0), "severity", "FATAL", "", ".*")
or
label_replace(vector(10), "severity", "WARN", "", ".*")
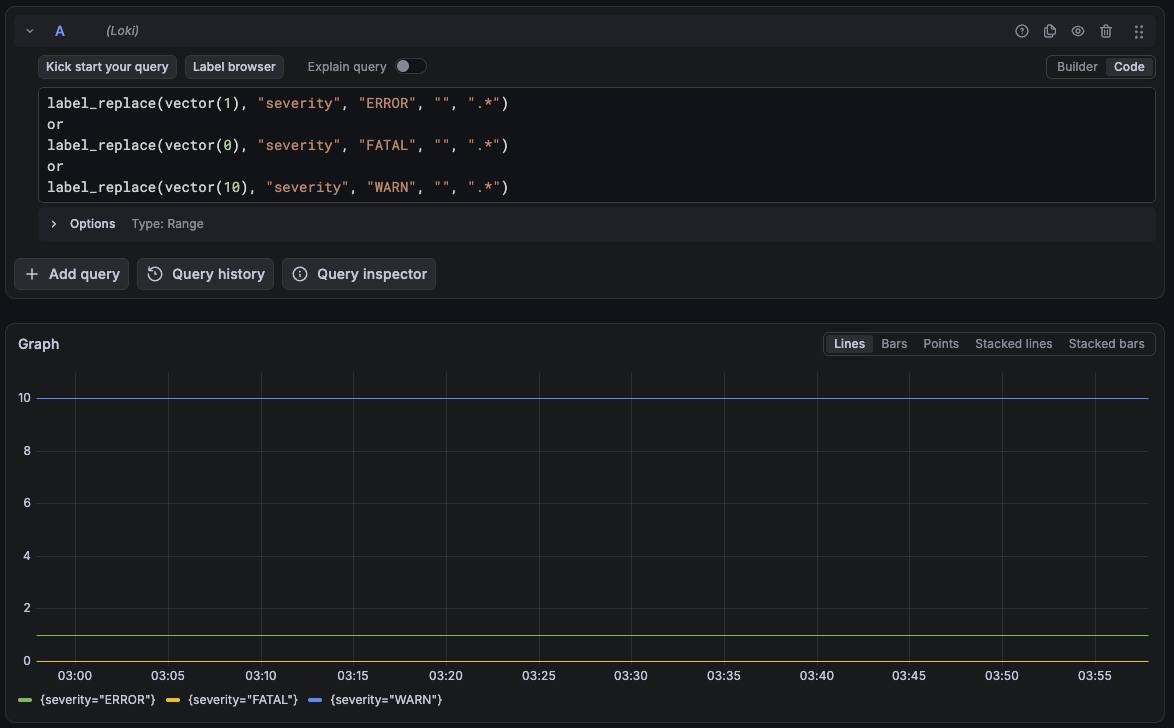
あとはこれをエラーの発生回数をカウントする LogQL の結果と比較して、閾値を超えていればアラートが発火するようにすれば OK です。
alert rule の annotation
alert rule の annotation は通知用のテンプレートで利用するために付与する必要があります。
Summary
まず summary として以下のようなテンプレートを記述します。ここで、「グループ化したエラーの代表的なエラーメッセージや stacktrace を抽出する LogQL」(latest_error) で抽出した error_message を参照しています。なお、見やすいように改行やインデントをしていますが、実際は 1 行です。
{{ with $labels.exception_type }}
  {{ . }}
{{ end }}
{{ with $values.latest_error }}
{{ with .Labels.error_message }}
  {{ if $labels.exception_type }}: {{ end }}{{ . }}{{ end }}
{{ end }}
Runbook
runbook は最後のエラーに runbook_url があればそれを採用し、なければ予め想定されている exception_type のものに対してのみ付与するようにします。
{{ $runbook := "" -}}
{{ with $values.latest_error -}}
  {{ with .Labels.runbook_url -}}
    {{ $runbook = . -}}
  {{ end -}}
{{ end -}}
{{ if not $runbook -}}
  {{ if eq $labels.exception_type "main.databaseError" -}}
    {{ $runbook = "https://example.com/runbooks/database" -}}
  {{ end -}}
{{ end -}}
{{ $runbook -}}
Stacktrace
stacktrace は最後のエラーのものを採用します。
{{ with $values.latest_error }}{{ with .Labels.exception_stacktrace }}{{ . }}{{ end }}{{ end }}
Explorer 用の annotation
Explorer 用の annotation として、まずはベースとなる LogQL の annotation を定義します。
explore_query
{{ printf "{service_name=%q, deployment_environment_name=%q}" $labels.service_name $labels.deployment_environment_name }}
次に、最後のエラーの時刻をベースにクエリする範囲となる情報を annotation として付与します。
explore_from
{{ with $values.latest_error }}{{ .Labels.error_time_from }}{{ end }}
explore_to
{{ with $values.latest_error }}{{ .Labels.error_time_to }}{{ end }}
通知に使う message template
Grafana のデフォルトのテンプレートは汎用的なものなので、良い感じに表示するには自前でテンプレートを用意する必要があります。
message template について説明していきます。
Slack title
title では summary annotation を参照します。以下のとおりとてもシンプルな内容です。見やすさのため改行していますが実際は 1 行です。
{{ .CommonLabels.service_name }}: {{ if .Alerts.Firing }}{{ (index .Alerts.Firing 0).Annotations.summary }}
{{ else if .Alerts.Resolved }}{{ (index .Alerts.Resolved 0).Annotations.summary }}
{{ else }}No alerts in notification
{{ end }}
Slack message
message には以下のようなテンプレートを定義することにしました。
{{ range .Alerts -}}
{{ .Annotations.description }}
  {{ $hasExplore := and .Annotations.explore_query .Annotations.explore_from .Annotations.explore_to -}}
  {{ $hasSilence := and .SilenceURL (le (len .SilenceURL) 5000) -}}
  {{ if or .Annotations.runbook_url .GeneratorURL .DashboardURL $hasExplore $hasSilence }}
*Actions*

    {{ with .Annotations.runbook_url -}}
- <{{ . }}|Go to runbook>
    {{ end -}}
    {{ with .GeneratorURL -}}
- <{{ . }}|Go to alert rule>
    {{ end -}}
    {{ with .DashboardURL -}}
- <{{ . }}|Go to dashboard>
    {{ end -}}
    {{ if $hasExplore -}}
      {{/* Use data.ToJSON instead of printf "%q", which can emit Go-only escapes such as \x01 that are invalid in JSON. */ -}}
      {{ $panes := printf "{\"logs\":{\"datasource\":\"loki\",\"queries\":[{\"datasource\":{\"type\":\"loki\",\"uid\":\"loki\"},\"editorMode\":\"code\",\"expr\":%s,\"queryType\":\"range\",\"refId\":\"logs\"}],\"range\":{\"from\":\"%s\",\"to\":\"%s\"}}}" (data.ToJSON .Annotations.explore_query) .Annotations.explore_from .Annotations.explore_to -}}
- <http://localhost:3000/explore?schemaVersion=1&panes={{ urlquery $panes }}|Explore logs>
    {{ end -}}
    {{ if $hasSilence -}}
- <{{ .SilenceURL }}|Create silence>
    {{ end -}}
  {{ end -}}
  {{ with .Annotations.stacktrace }}
*Stack trace*

```
{{ printf "%.3000s" . }}
```
  {{ end }}
  {{ $firstLabel := true -}}
  {{ range $key, $value := .Labels -}}
    {{ if and (ne $key "error_group") (ne $key "service_name") -}}
      {{ if $firstLabel -}}
*Other labels:*

        {{ $firstLabel = false -}}
      {{ end -}}
- {{ $key }}: {{ $value }}
    {{ end -}}
  {{ end }}
  {{ $firstAnnotation := true -}}
  {{ range $key, $value := .Annotations -}}
    {{ if and (ne $key "summary") (ne $key "description") (ne $key "runbook_url") (ne $key "stacktrace") (ne $key "explore_query") (ne $key "explore_from") (ne $key "explore_to") -}}
      {{ if $firstAnnotation -}}
*Other annotations:*

        {{ $firstAnnotation = false -}}
      {{ end -}}
- {{ $key }}: {{ $value }}
    {{ end -}}
  {{ end }}
{{ end -}}
メッセージが長大な場合、Slack か Grafana で text を 1 万文字ぐらいで truncate するようになっているようなので stacktrace が長過ぎる場合は silence への URL を非表示にしたり、stacktrace 情報は以下のように 3,000 文字で切るようにしています。
  {{ with .Annotations.stacktrace }}
*Stack trace*

```
{{ printf "%.3000s" . }}
```
  {{ end }}
何文字まで大丈夫なのかまでは厳密には検証していないので調整が必要な箇所です。